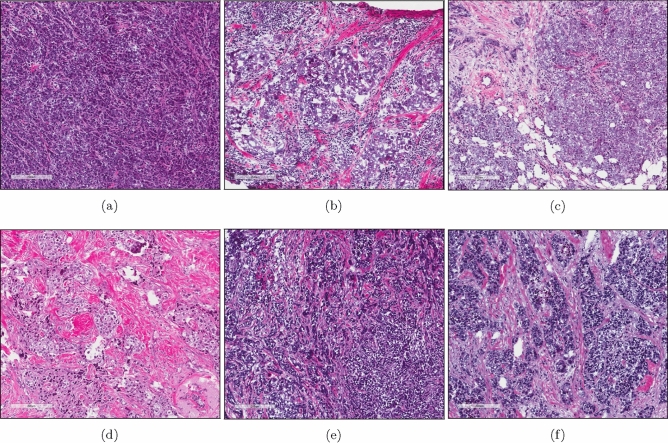
Figure 6.
Example H&E images of TCGA TNBC cases with a high quantity of T cells (CD8 and CD4 memory activated) (a–c) or a low quantity of T cells (CD8 and CD4 memory activated) (d–f) as scored by RNA-Seq gene expression analysis by CIBERSORT. (a) TCGA-AO-A128. (b) TCGA-GM-A2DI. (c) TCGA-OL-A66I. (d) TCGA-A7-A26I. (e) TCGA-BH-A0AV. (f) TCGA-OL-A5RW. (a)–(f) Image captures made from TCGA image files opened with Aperio ImageScope 12.3.2.8013 (https://www.leicabiosystems.com/digital-pathology/manage/aperio-imagescope/).

