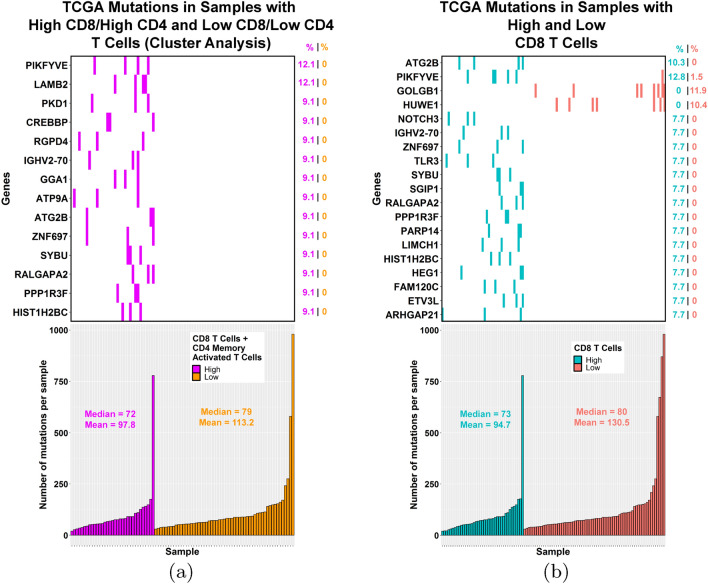
Figure 9.
Genes with significantly different mutation frequencies between TCGA TNBC samples with high or low T cells (CD8/CD4 memory activated or CD8). (a, top) 14 genes show significantly different mutation frequencies (p < 0.05, Fisher’s exact test) between the group enriched in both CD8 T cells and CD4 memory activated T cells as compared to the group low in these T cells. (a, bottom) Mutation counts were similar between the two groups. (b, top) 19 genes show significantly different mutation frequencies (p < 0.05, Fisher’s exact test) between the high and low CD8 T cell groups. (b, bottom) Mutation counts were similar between the high and low CD8 T cell groups. (a) and (b) Images generated with R 4.0.2 (https://www.R-project.org)35.

