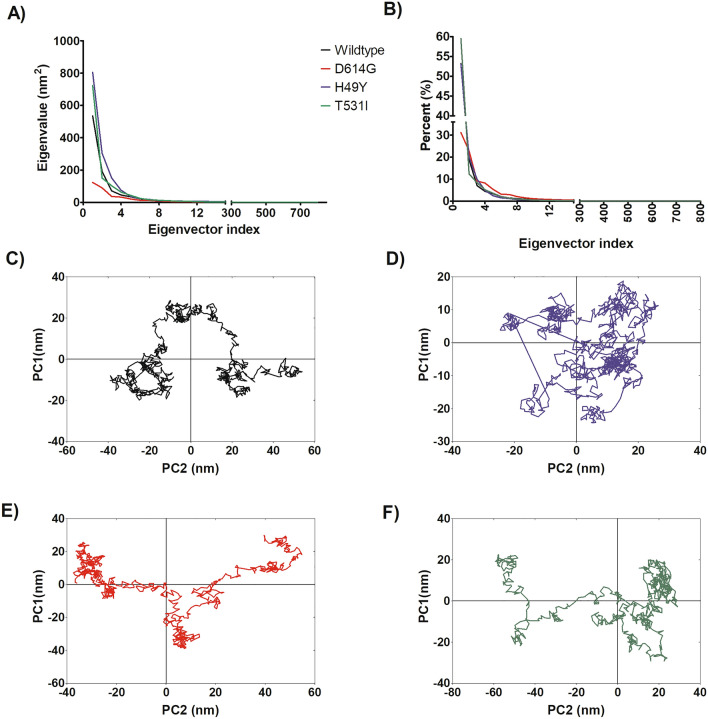
Figure 4.
Principal component analysis of WT and mutated spike proteins. (A) eigenvectors of the covariance matrix, (B) percentage of each eigenvector vs eigenvalues, (C) projection of the motion in the phase space along the first and second eigenvectors (PC2 vs. PC1) of the WT, (D) projection of the motion in the phase space along the first and second eigenvectors (PC2 vs. PC1) of the D614G, (E) projection of the motion in the phase space along the first and second eigenvectors (PC2 vs. PC1) of the H49Y, (F) projection of the motion in the phase space along the first and second eigenvectors (PC2 vs. PC1) of T573I. Wild type spike protein is depicted in black, D614G in red, H49Y in green, and T573I in purple.

