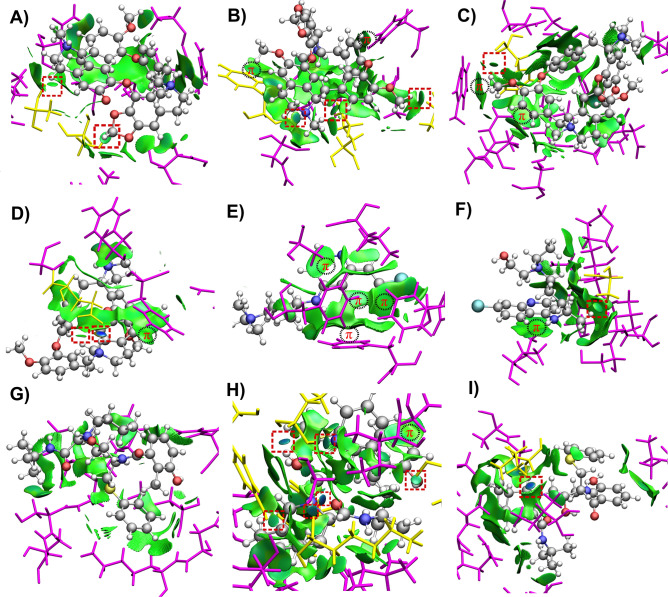
Figure 7.
The NCI isosurfaces (drawn at 0.5) of (A) Cepharanthine-D614G, (B) Cepharanthine-H49Y, (C) Cepharanthine-T573I, (D) Cepharanthine-WT, (E) Hydroxychloroquine-H49Y, (F) Hydroxychloroquine-T573I, (G) Nelfinavir-H49Y, (H) Nelfinavir-T573I and (I) Nelfinavir-WT complexes. Blue and green regions represent strong attractive and weak dispersive interactions, respectively. The localized interactions are marked in a red square. The regions of π-interactions are also indicated. The amino-acid residues forming localized and delocalized interactions with the ligand are depicted in yellow and magenta, respectively.

