Figure 1.
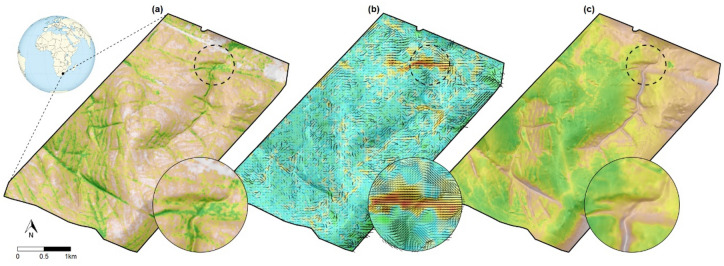
Overview of the study area with three examples of how normal behavior varies spatially: (a) topography and tree cover in the study area (white to green with increasing tree cover); (b) movement speed (third quartile) and directionality of wildebeest during the afternoon (blue to red with increasing speed; length and darkness of line segments indicates the degree of directional preference and orientation indicates the preferred movement direction); and (c) modelled habitat suitability of wildebeest during the afternoon as function of habitat characteristics (white to green with increasing suitability). The inset figures exemplify the importance of considering environmental context in the early warning system, since fast, straight and directional movements through low suitability areas are part of the sentinels’ normal behavior. Thus, solely detecting fast and straight movements may not suffice as early warning indicators. All maps were generated in R3.5.0 using GIS, location and modelled data49.

