Figure 2.
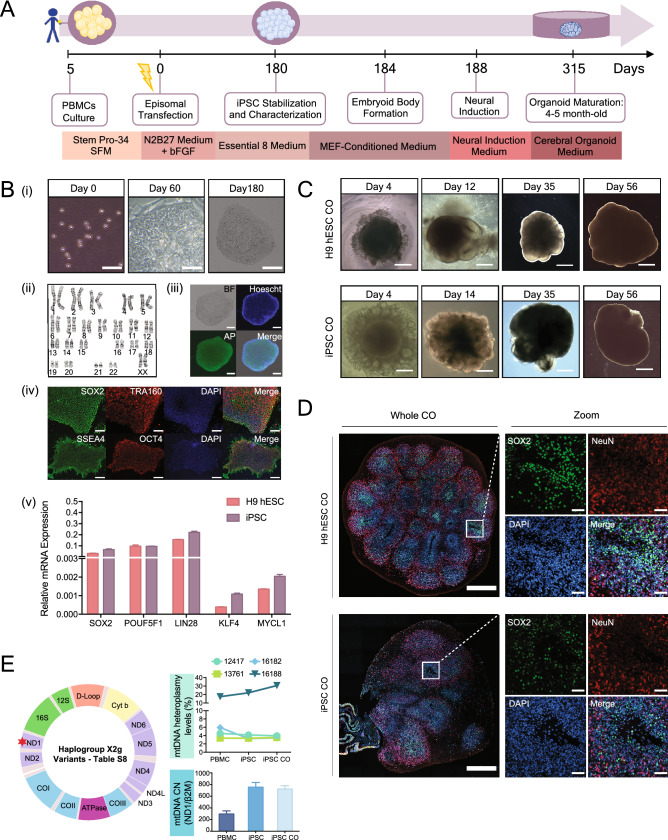
Generation and characterization of cerebral organoids from PBMCs-derived iPSCs and H9 hESCs. (A) Timeline and protocol schematic from peripheral blood mononuclear cells (PBMCs) to induced pluripotent stem cells (iPSCs) to cerebral organoids (COs). (B) (i) Representative bright-field images showing PBMCs on Day 0, scale bar, 50 μm, reprogramming iPSCs on Day 60, scale bar, 50 μm, and a fully stabilized iPSC colony on Day 180, scale bar, 200 μm; (ii) chromosome analysis with normal female karyotype (46, XX) in 20 cells examined; (iii) representative fluorescent images of iPSCs stained positive for alkaline phosphatase, scale bar, 100 μm; (iv) representative immunofluorescent images of iPSCs stained positive for a set of pluripotency markers, SOX2, TRA160, SSEA4 and OCT4, scale bar, 600 μm; (v) Bar graph showing relative mRNA expression of pluripotency markers, SOX2, POUF51, LIN28, KLF4 and MYCL1. Bars, mean ± SD. (C) Representative bright field images showing the progression of cerebral organoid development in H9 hESCs (top panel, scale bars, 250 μm, 250 μm, 500 μm and 1 mm from left to right) and iPSCs (bottom panel, scale bars, 250 μm, 500 μm, 500 μm and 1 mm from left to right). (D) Representative fluorescent immunohistochemistry images of whole cerebral organoid in 4.5-month H9 hESC CO and iPSC CO section view (scale bar, 500 μm) and magnified view (scale bar, 50 μm) expressing nuclei (DAPI), radial glia (SOX2) and mature postmitotic neurons (NeuN). Note that immunofluorescent images were used for qualitative observations. (E) Mitochondrial (mt-) DNA haplogroup, heteroplasmy and copy number (CN) characterization across PBMCs, iPSCs and iPSC COs. Top right: graph showing mtDNA heteroplasmy levels at four nucleotide positions (MT-12417, MT-13761, MT16182 and MT-16188). Bottom right: graph showing relative mtDNA CN, expressed as MT-ND1/β2M ratio. Schematic of the mitochondrial DNA (left). Red star denotes the mtDNA region used to evaluate mtDNA CN. For more information on the haplogroup X2g variants, see Table S8.

