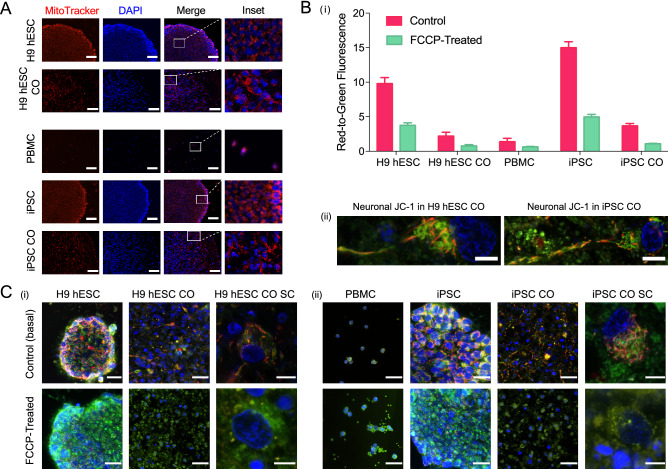
Figure 3.
Characterization of active, functional and responsive mitochondria throughout CO generation. (A) Active mitochondria in H9 hESCs (scale bar, 100 μm), H9 hESC COs (scale bar, 50 μm), PBMCs (scale bar, 100 μm), iPSCs (scale bar, 100 μm) and iPSC COs (scale bar, 65 μm) stained with MitoTracker Red CMXRos (red) and DAPI (nuclei, blue). Last column shows insets, enlarged views of boxed areas from the merge images. (B) (i) Bar graph summarizing mitochondrial membrane potential (MMP) as red-to-green fluorescence ratio across primary, reprogrammed and differentiated stages in samples treated with JC-1 only (control basal MMP level) and those treated with carbonyl cyanide-4-(trifluoromethoxy)phenylhydrazone (FCCP). Fluorescence was recorded using a microplate reader. Bars, mean ± SD; (ii) Representative MMP images of a fully captured neuron with cell body and axon projection in H9 hESC CO (left, scale bar, 5 μm) and iPSC CO (right, scale bar, 7 μm). Red, JC-1 aggregates (highly energetic or polarized), green, JC-1 monomers (less energetic or depolarized). (C) (i) Top row shows representative MMP images across CO generation from H9 hESCs (scale bar, 25 μm) to H9 hESC CO (scale bar, 25 μm) or hESC CO single cell (SC, scale bar, 10 μm) and; (ii) from PBMCs (scale bar, 25 μm) to iPSCs (scale bar, 25 μm) to iPSC COs (scale bar, 25 μm) or iPSC CO SC (scale bar, 5 μm). Bottom row shows representative images of samples treated with FCCP followed by JC-1 to visualize the collapse of MMP in (i) H9 hESCs (scale bar, 25 μm) to H9 hESC CO (scale bar, 25 μm) or hESC CO SC (scale bar, 5 μm) and; (ii) from PBMCs (scale bar, 25 μm) to iPSCs (scale bar, 25 μm) to iPSC COs (scale bar, 25 μm) or iPSC CO SC (scale bar, 5 μm). All images were captured at ×100 magnification with slight variations in the zoom factor to capture the single cell(s) or single colony of interest. Immunofluorescent images shown here were used for qualitative observations only.

