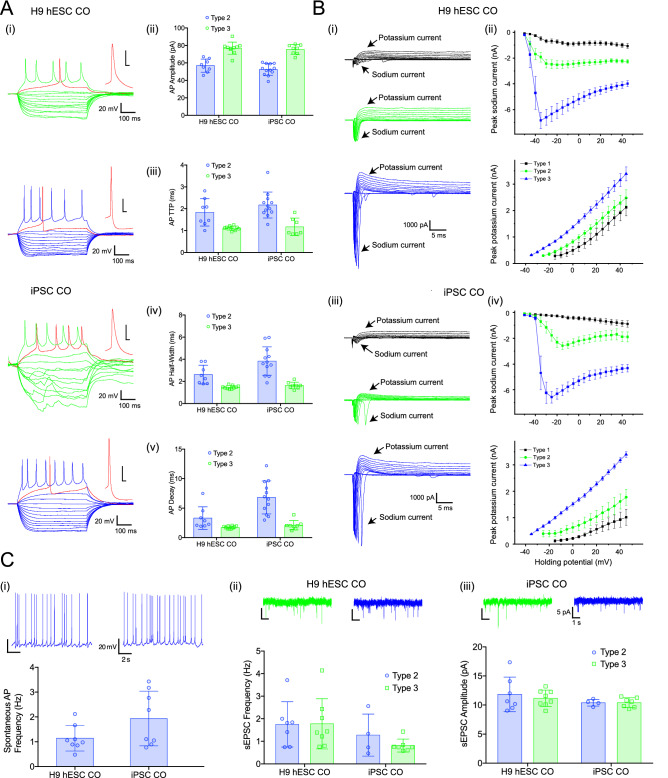
Figure 5.
Electrophysiological characterization in H9 hESC-derived COs and iPSC-derived COs. (A) (i) Examples of voltage responses to hyperpolarizing and depolarizing set of currents recorded from type 2 (green) and type 3 (blue) neurons. Individual APs are expanded in the insert (red), scale 20 mV/5 ms. Summary bar graphs showing (ii) AP amplitudes, (iii) rise time, (iv) half-width and (v) decay, note that APs have lower amplitude and slower kinetic in type 2 neurons. (B) (i) Examples of inward sodium and outward potassium currents recorded from neurons type 1 (black), type 2 (green) and type 3 (blue). Scale bar is the same for all traces. Summary current–voltage plots showing increase in peak current amplitude for both sodium (top) and potassium (bottom) during neuronal maturation (ii and iii). These plots look similar independently of COs origin. (C) (i) Examples of spontaneous AP firing in type 3 neurons (top) and summary bar graph of AP frequency in H9 hESC- and iPSC-derived COs (bottom). (ii) Examples of spontaneous excitatory postsynaptic currents (EPSCs) recorded from type 2 (green) and type 3 (blue) neurons. Scale bar is the same for all traces. (iii) Summary bar graphs showing that spontaneous synaptic activity including sEPSC frequency (left) and amplitude (right) was similar in both types of neurons regardless origin of COs. Error bars show standard deviation.

