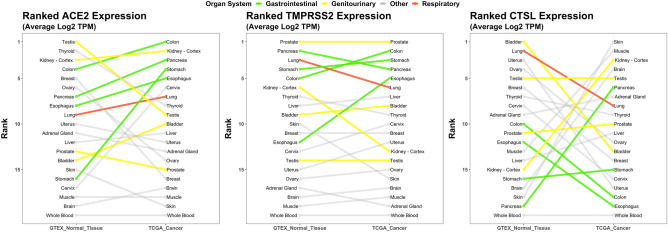
Figure 2.
RNA expression of ACE2, TMPRSS2, and CTSL in normal and malignant tissues. RNA expression of ACE2 (left), TMPRSS2 (middle), and CTSL (right) in 20 matched normal and malignant tissues from the Genotype-Tissue Expression Portal (GTEx, n = 4,744 Samples)29 and The Cancer Genome Atlas (TCGA, n = 9,026 Samples)30; respectively. The mean expression in log2 TPM (transcripts per million) was calculated for each tissue, then ranked based on each gene. Organ systems of interest are highlighted by colour: gastrointestinal tract (green), genitourinary tract (yellow), respiratory tract (red), and other organ systems (grey).

