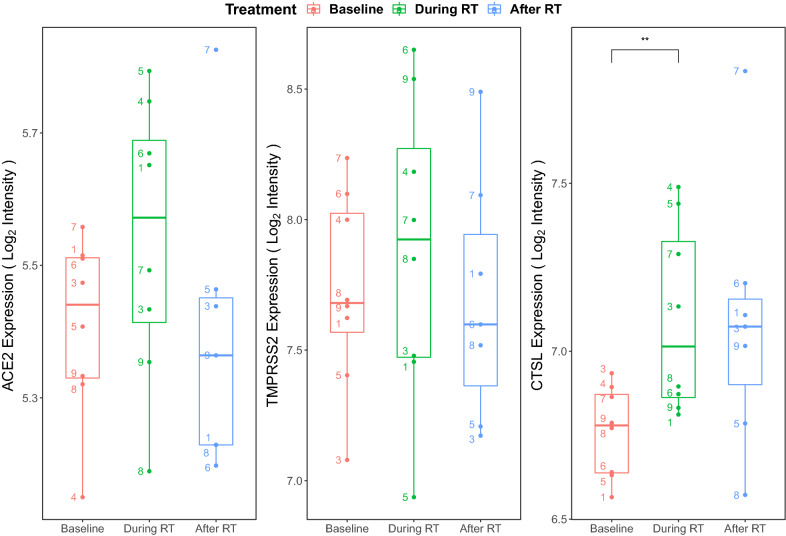
Figure 5.
Effects of radiotherapy on ACE2, TMPRSS2, and CTSL expression. Expression of ACE2 (left), TMPRSS2 (middle), and CTSL (right) in buccal mucosa before, during, and after radiotherapy (RT) among 8 tonsillar squamous cell carcinoma patients from the GSE103412 data set. The probe intensity for each gene was log2 transformed and visualised for each treatment group to present normalized gene expression values. Paired t-tests were performed between adjacent time points and significant differential expression between groups was labelled. The numbers denote each of the 8 individual patient’s data points. Of note, patient #2′s data was not available for download from the Gene Expression Omnibus (GEO) database. **p < 0.01 between baseline and during radiotherapy.

