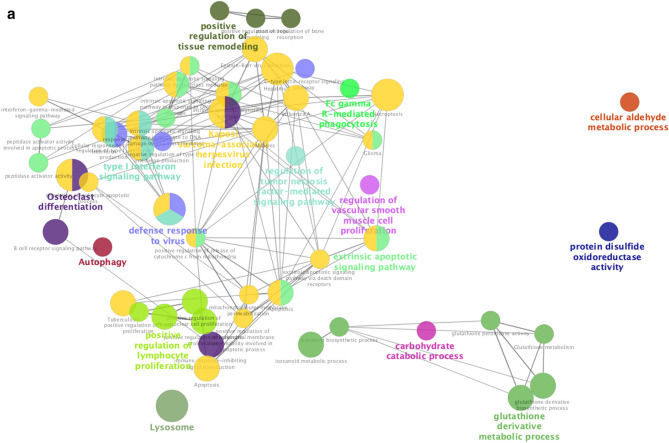
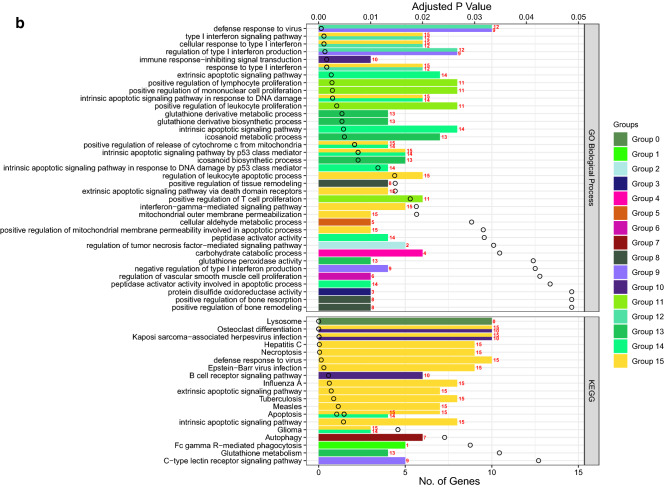
Figure 7.
Functional analysis of upregulated genes during chemotherapy and COVID-19. Functional analysis using Cytoscape ClueGo App57–59 was performed on genes upregulated in peripheral mononuclear blood cells that are shared between chemotherapy treatment (GSE39324) and COVID-1935. The response to cyclophosphamide was analyzed in one patient with T-cell prolymphocytic leukemia, one patient with plasma cell leukemia, and eight patients with multiple myeloma. (a) Network of functional groups derived from ClueGO enrichment analysis showing 16 functional groups derived by Kappa statistics. The leading functional term for each group, defined by the term with the lowest adjusted p-value (Bonferonni step down method) within each cluster is coloured in bold. An overall q-value threshold of < 0.05 was used. Nodes are coloured by functional groups and the size of nodes are proportional to the q-value. (b) Bar chart of functional groups derived from ClueGO enrichment analysis. Terms are ordered by q-value, which is also presented on the upper y-axis; the q-value for each term is marked with a black circle. The lower x-axis defines the number of genes within each functional term. Terms are coloured by group, and the group is labelled to the right of each bar for clarity. The bar chart is also separated into 2 facets: GO Biological Process (top) and KEGG (bottom).


