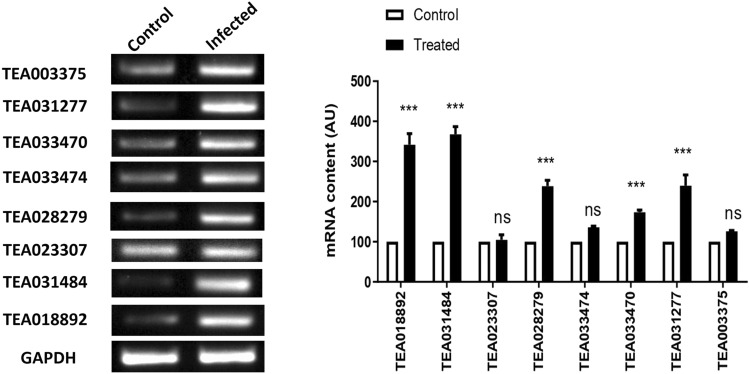
Fig. 9.
The gel image and bar diagram represent the semi-quantitative PCR amplification of the selected chitinase genes in the control (uninfected) and E. vexans challenged tea tissues. The bars in the figure indicates mean ± SEM, n = 3. The p-values are from a 2 way ANOVA test, *** represents p < 0.0001, ns = not significant at p < 0.0001

