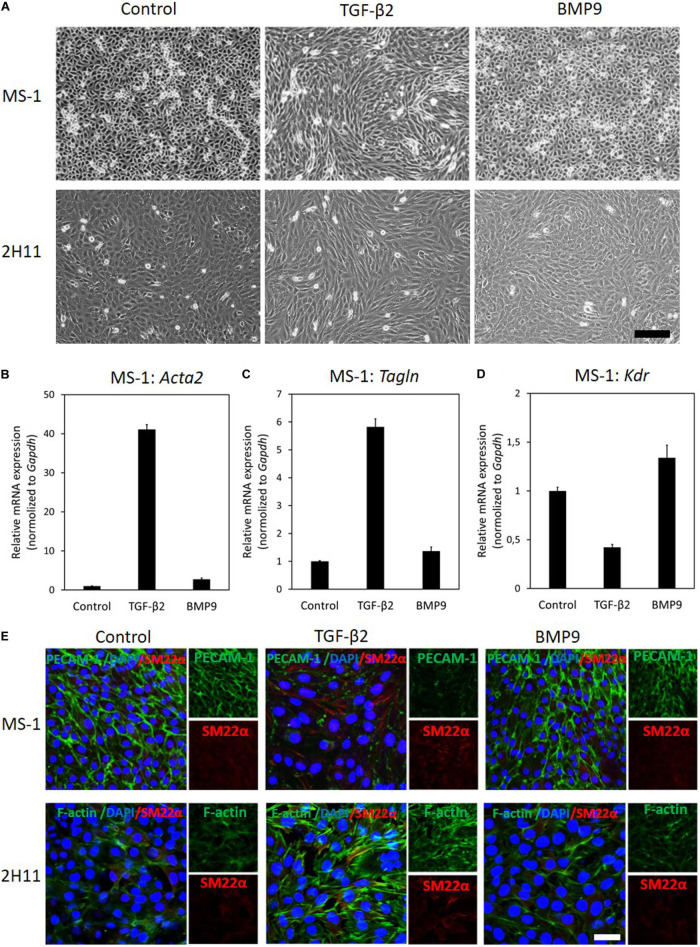
FIGURE 1.
TGF–β2 induces EndMT whilst BMP9 does not. (A) Assessing cell morphological changes induced by TGF–β2 and BMP9. Brightfield microscopy images of MS–1 (upper panel) and 2H11 (lower panel) cells showing distinct cell morphologies (i.e., cobblestone or fibroblast–like) after TGF–β2 (1 ng ml–1) and BMP9 (5 ng ml–1) treatments for 3 days. Scale bar: 200 μm. (B–D) RT-qPCR analysis of endothelial and mesenchymal markers in MS-1 cells. MS-1 cells were exposed to medium containing TGF-β2 (1 ng ml–1) or BMP9 (5 ng ml–1) or medium containing ligand buffer (control) for 3 days. The expression of mesenchymal cell marker genes Acta2 (B) and Tagln (C) and endothelial cell marker gene Kdr (D) was quantified by RT-qPCR. Expression levels were normalized to those of the housekeeping gene Gapdh. Results are expressed as mean ± SD. Representative results from three independent experiments are shown. (E) Fluorescence microscopy analysis of endothelial and mesenchymal markers in MS-1 and 2H11 cells. MS-1 and 2H11 cells were incubated in medium containing TGF-β2 (1 ng ml–1) or BMP9 (5 ng ml–1) or medium containing ligand buffer (control) for 3 days. The expression of the endothelial cell marker PECAM-1 (green) and mesenchymal cell marker SM22α (red) in nuclei (blue) stained MS-1 cells (upper panel) and mesenchymal cell markers F-actin (green) and SM22α (red) in nuclei (blue) stained 2H11 cells (lower panel) were assessed by using immunofluorescent staining, respectively. Representative results from at least three independent experiments are shown. Scale bar: 50 μm.

