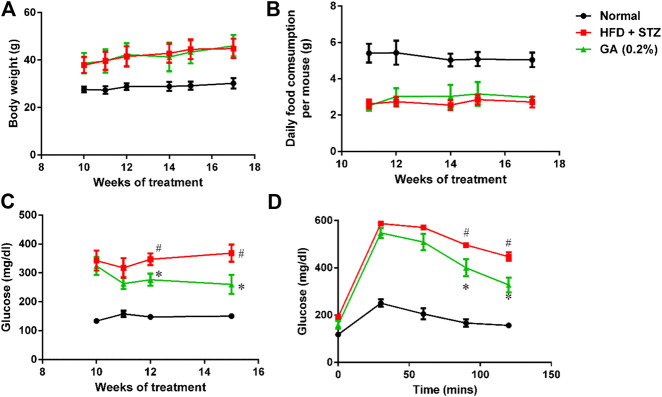
FIGURE 1.
Analysis of physiological and biochemical parameters (A) Mice body weights (B) Variations in food consumption per mouse (C) Random blood glucose (RBS) test (D) Oral glucose tolerance test (OGTT). Seven to eight mice from each group were subjected to the RBS test on the 10th, 11th, 12th, and 15th week. Six mice from each group were subjected to the OGTT on the 16th week. In the OGTT, fasting glucose was conduct at 0 min; subsequently, the mice were orally fed with glucose (2 g/kg), and the blood glucose contents were measured at 30, 60, 90, and 120 min. # significant difference between the diabetic (HFD + STZ) and control (normal) groups (p < 0.05); * significant difference between the treatment (GA 0.2%) and diabetic groups (p < 0.05).

