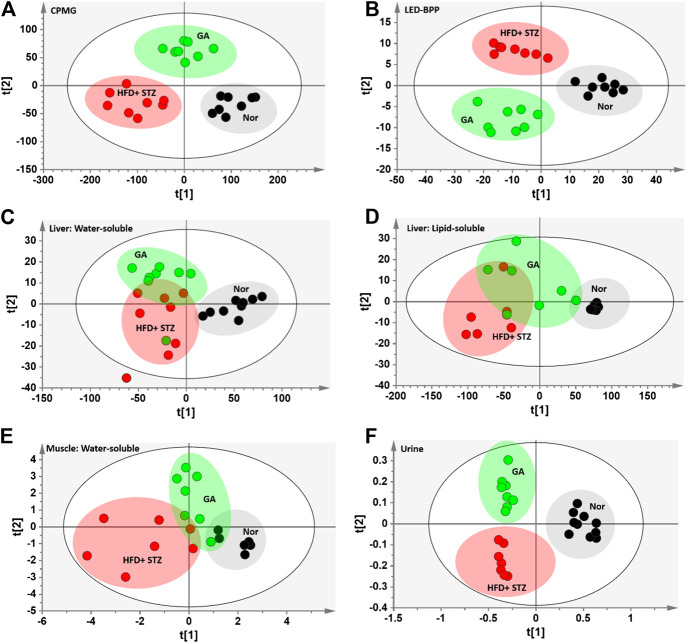
FIGURE 4.
PLS-DA score plots (A) Carr-Purcell-Meiboom-Gill (CPMG) spectrum of serum samples for small molecule metabolites (R2X = 0.736, R2Y = 0.875, Q2 = 0.845) (B) Longitudinal eddy-current delay-bipolar pulse pair (LED-BPP) spectrum of serum samples for large-molecule metabolites (R2X = 0.841, R2Y = 0.892, Q2 = 0.874) (C) Nuclear Overhauser effect spectroscopy (NOESY) spectrum of liver samples for water-soluble metabolites (R2X = 0.736, R2Y = 0.586, Q2 = 0.359) (D) NOESY spectrum of liver samples for lipid-soluble metabolites (R2X = 0.927, R2Y = 0.567, Q2 = 0.332) (E) NOESY spectrum of muscle samples for water-soluble metabolites (R2X = 0.433, R2Y = 0.618, Q2 = 0.435) (F) NOESY spectrum of urine samples for metabolites (R2X = 0.646, R2Y = 0.892, Q2 = 0.799). Nor: normal group; HFD + STZ: diabetes group; GA: treatment group.

