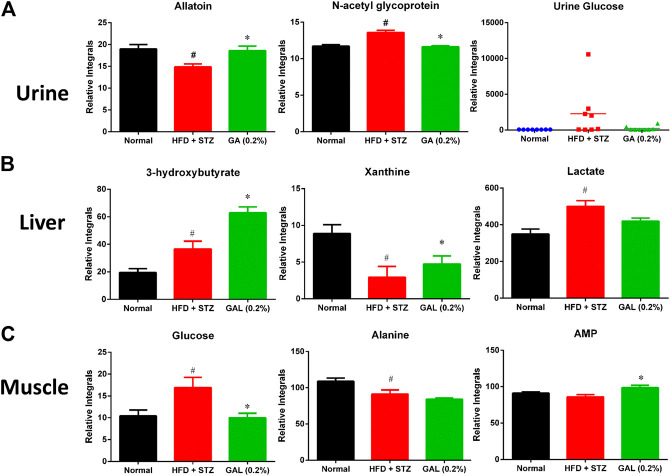
FIGURE 7.
Effect of GA on changes in urinary, hepatic and muscle metabolites (A) Urine (B) Liver (C) muscle. # indicates a significant difference between the diabetes (HFD + STZ) and control (normal) groups (p < 0.05); * indicates a significance difference between the treatment (GA 0.2%) and diabetes groups (p < 0.05).

