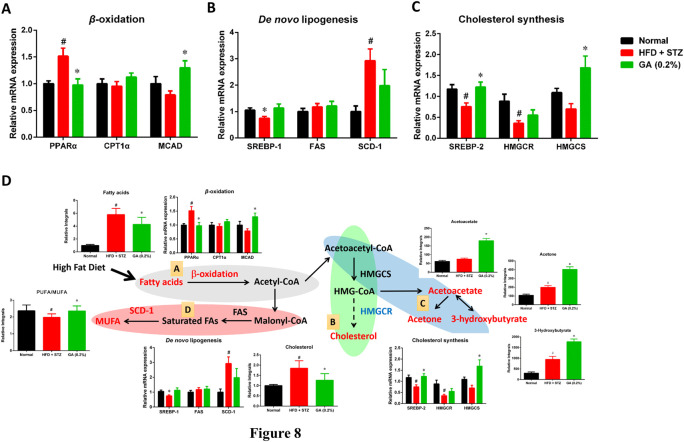
FIGURE 8.
Possible mechanisms used by GA in alleviating accumulation of hepatic lipids in diabetic and NASH mice, induced by HFD and STZ (A) Regulation of β-oxidation genes (B) regulation of de novo lipogenesis genes; (C) regulation of cholesterol synthesis genes; (D) possible mechanisms, A Lipolysis—β-oxidation (gray); B cholesterol synthesis (green); C ketogenesis (blue); D lipid synthesis—de novo lipogenesis (red). Red indicates significant upregulation of metabolite or enzyme expression in diabetic mice, while blue indicates significant downregulation. Black indicates a metabolite or enzyme that is undetectable or exhibited non-significant changes. PPARα (peroxisome proliferator-activated receptor alpha), CPT1 (carnitine palmitoyltransferase, MCAD (medium-chain acyl-CoA dehydrogenase), SREBP-1 (sterol regulatory element-binding transcription factor 1), FAS (fatty acid synthase), SCD-1 (stearoyl-CoA desaturase-1), SREBP-2 (sterol regulatory element-binding transcription factor 2), HMG-CoA reductase (3-hydroxy-3-methyl-glutaryl-CoA reductase), HMG-CoA synthase (3-hydroxy-3-methyl-glutaryl-CoA synthase). Metabolites: MUFA (monounsaturated fatty acid), HMG-CoA (3-hydroxy-3-methylglutaryl-coenzyme A. # significant difference between the diabetic (HFD + STZ) and control (normal) groups (p < 0.05); * significant difference between the treatment (GA 0.2%) and diabetic groups (p < 0.05).

