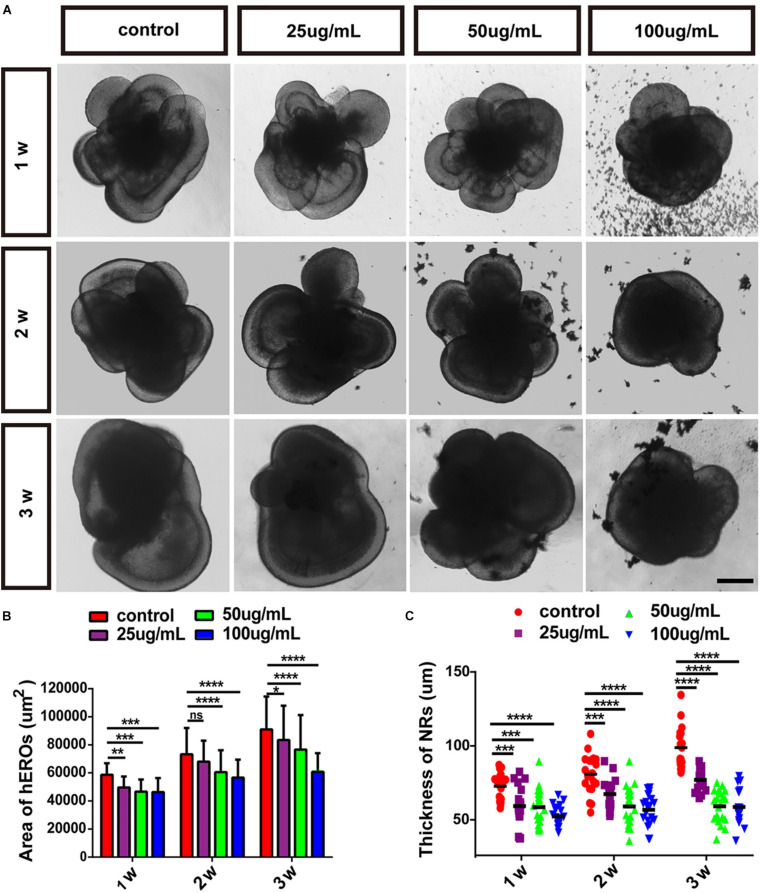
FIGURE 2.
The effects of PM2.5 on the area of hEROs and the thickness of hERO-NRs. (A) Bright-field images of hEROs after exposure to four concentrations, group of PM2.5 continuous processing three periods at 1, 2, and 3 weeks. Scale bar = 100 μm. (B) The area of the hEROs in each group was calculated and statistically analyzed. (C) The thickness of the neural retina in each group was calculated and statistically analyzed (control vs. 25 μg/ml vs. 50 μg/ml vs. 100 μg/ml) in PM2.5-treated hEROs after 1, 2, and 3 weeks, respectively. n = 3 independent experiments per group; each group contains 40 hEROs (*P < 0.05, **P < 0.01, ***P < 0.001, ****P < 0.0001).

