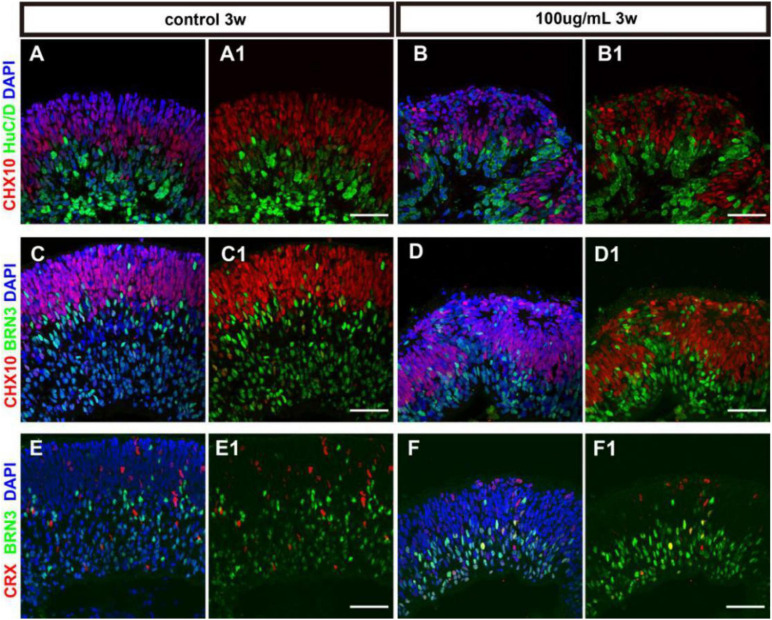
FIGURE 5.
The cell differentiation of hERO-NRs with 100 μg/ml PM2.5 exposure. (A–D) Immunostaining analysis of retinal differentiation-related markers in the hERO-NRs (after 3 weeks, 100 μg/ml PM2.5 treatment). (A,B) Co-tagging of Chx10 and HuCD at control group and PM2.5-100 μg/ml group. (C,D) Co-tagging of Chx10 and BRN3 in the control group and PM2.5-100 μg/ml group. (A1–D1) shows (A–D) without DAPI, respectively. (E,F) Immunostaining analysis of CRX and BRN3 in the hERO-NRs (after 3 weeks, 100 μg/ml PM2.5 treatment). (E1,F1) show (E,F) without DAPI, respectively. Scale bar = 50 μm.

