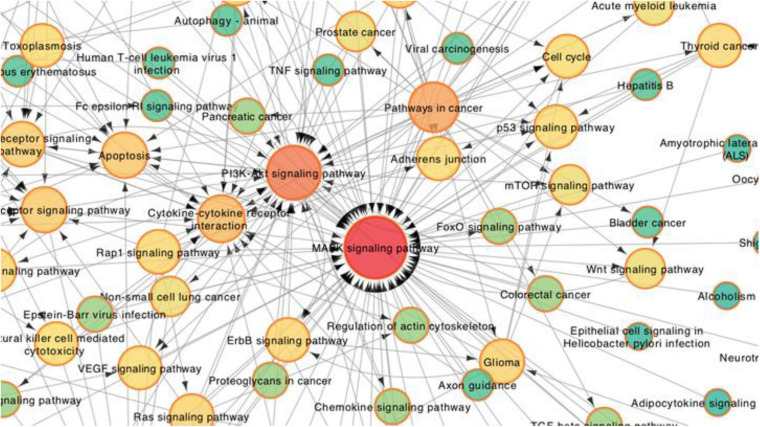
FIGURE 7.
Partial enlargement of the pathway-act network analysis between PM2.5-100 μg/ml treatment with the control group of the hEROs at 3 weeks. Each node represents a signaling pathway. Arrows represent interactive relationships between two signaling pathways. The size and color of the circle represent the significance of the difference between the groups in the KEGG pathway. The circular red shades represent the clustering coefficients. A darker color indicates more strongly associated pathways. The direction of the arrow represents the upstream and downstream relationship of the path.

