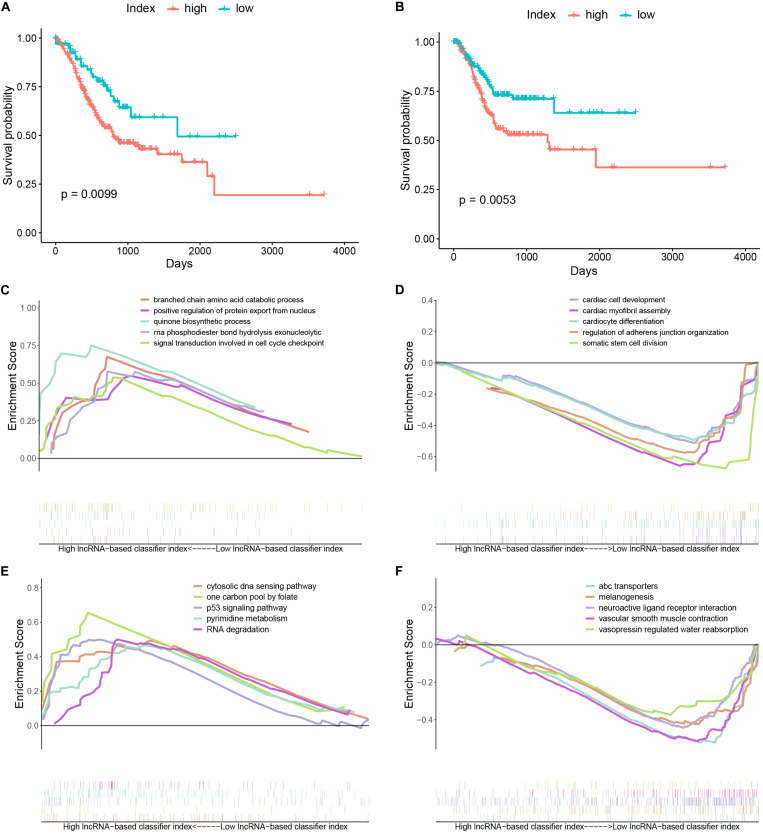
FIGURE 4.
Kaplan–Meier curves and gene set enrichment analysis. (A) Kaplan–Meier curves of overall survival in the high- and low-index groups. (B) Kaplan–Meier curves of relapse-free survival in the high- and low-index groups. (C) Top 5 significant biological processes enriched in samples with a high value of the 33-lncRNAs-based classifier index. (D) Top 5 significant biological processes enriched in samples with a low value of the 33-lncRNAs-based classifier index. (E) Top 5 significant KEGG pathways enriched in samples with a high value of the 33-lncRNAs-based classifier index. (F) Top 5 significant KEGG pathways enriched in samples with a low value of the 33-lncRNAs-based classifier index.

