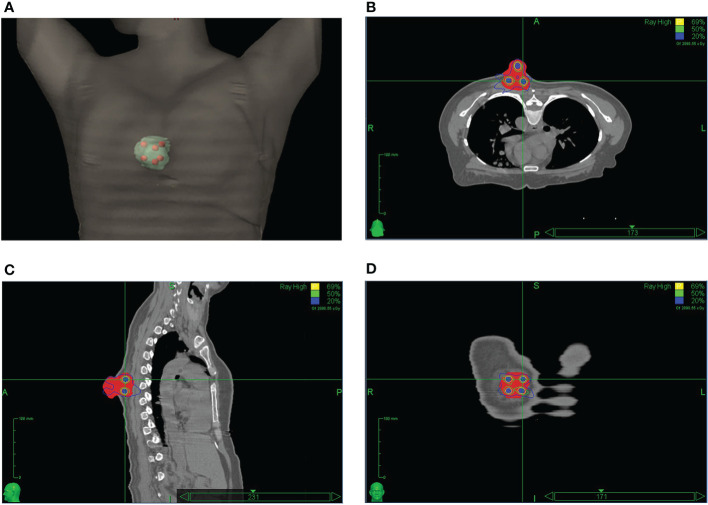
Figure 2.
The LATTICE dose distribution in a 3D view (A); in an axial plane (B); in a sagittal plane (C); and in a coronal plane (D). The high-dose vertices (total of six) received 20 Gy to the 69% isodose line. The doses between the dose-vertices (valley) were in the order of 25% of the maximum (peak) dose. (Permission by Radiation Research to extract from Figure 3 in Wu X et al. (10). © 2021 Radiation Research Society).

