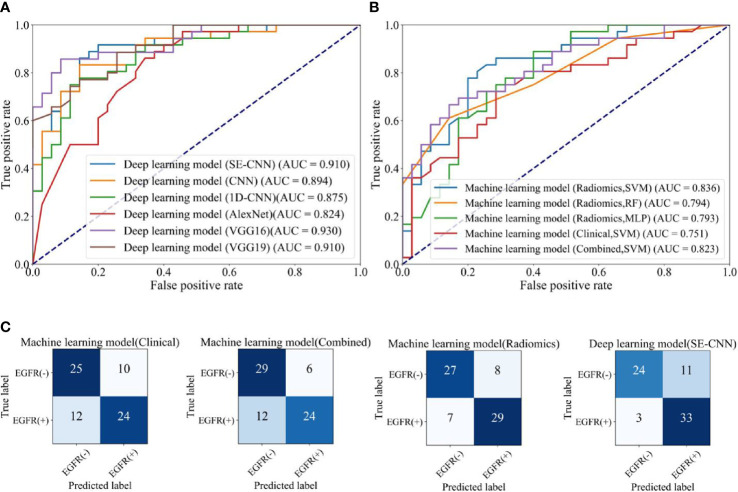
Figure 5.
The EGFR status recognition performance of different models for the internal test cohort (71 of 709 patients). (A) ROC curves of different deep learning models. (B) ROC curves of machine learning models using clinical features, radiomics features (SVM, RF, MLP), and combined features. (C) Confusion matrix of machine learning model using clinical features, machine model using combined features, machine learning models (SVM) using radiomics features, and deep learning model (SE-CNN).

