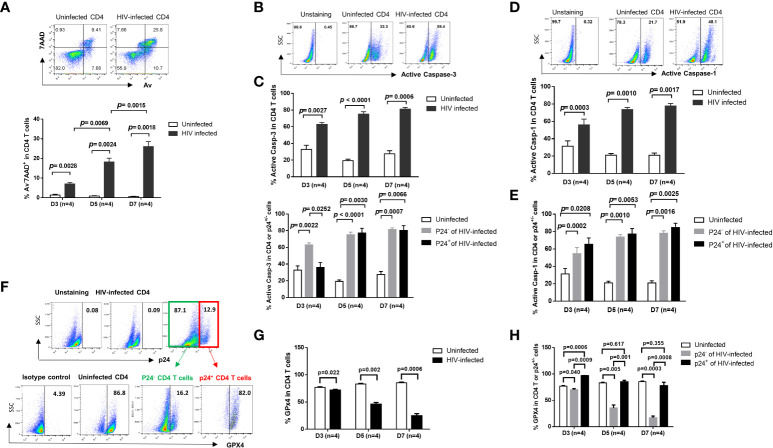
Figure 1.
HIV induces CD4 T cell death in productively infected and bystander cells during early infection via different mechanisms. (A) Representative dot plots (day 7) and summary of the percentage (%) of Av and 7AAD levels in HIV-infected and uninfected CD4 T cells, as determined by flow cytometry. (B, C) Representative dot plots and summary data showing active caspase-3% in productively HIV-infected (p24+) and bystander (p24-) or uninfected cells at days 3, 5, and 7 in cultures. (D, E) Representative dot plots and summary data of active caspase-1% in HIV-infected (p24+) and bystander (p24-) or uninfected cells at day 3, day 5, and day 7. (F–H) Representative dot plots and summary data of GPX4% in HIV-infected (p24+) and bystander (p24-) or uninfected cells at days 3, 5, and 7.

