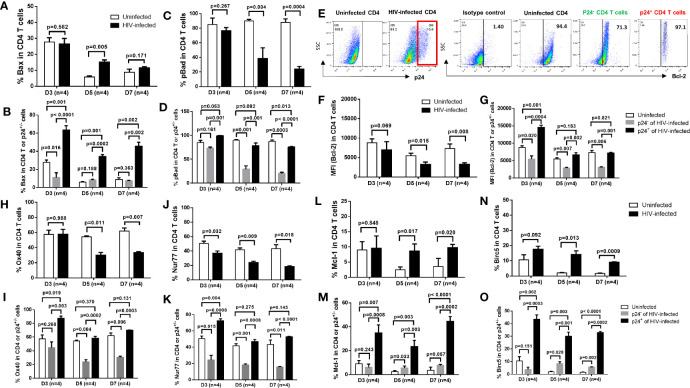
Figure 2.
Expression of pro- and anti-apoptotic proteins in productively infected cells and bystander cells during HIV infection. (A, B) Summary data of Bax % in HIV-infected (p24+ -) and bystander (p24-) or uninfected cells at days 3, 5, and 7, as determined by flow cytometry. (C, D) Summary data of pBad % in HIV-infected (p24+) and bystander (p24-) or uninfected cells at days 3, 5, and 7. (E–O) Representative dot plots and summary data of Bcl-2%, Ox40% (H, I), Nur77% (J, K), Mcl-1 (L, M), and Birc5% (N, O) in HIV-infected (p24+ vs. p24-) and uninfected cells at days 3, 5, and 7.

