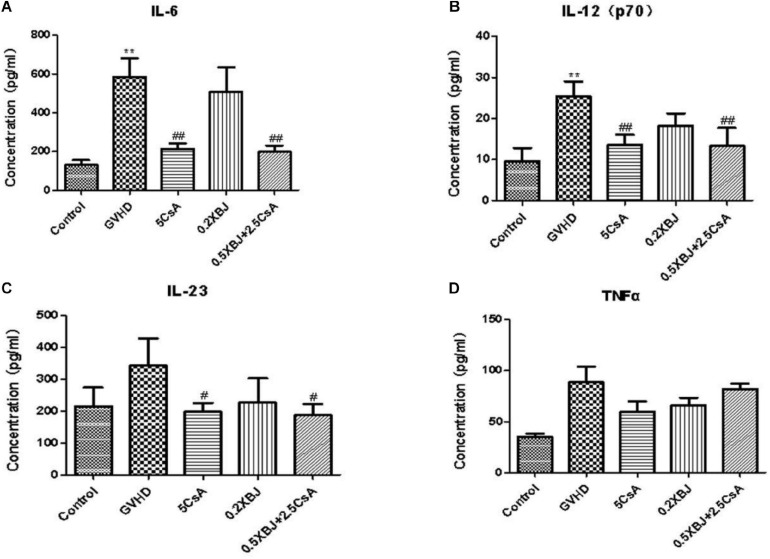
FIGURE 2.
Effects of different treatments on inflammatory cytokines in GVHD mice. On the seventh day after transplantation, serum from different groups of mice was collected and subjected to cytokine array analysis. Statistical analysis of IL-6 (A), IL-12(p70) (B), IL-23 (C), and TNF-α (D) was presented. *The significant difference between control and GVHD groups; #the significant difference between each treatment group and the GVHD group. **P < 0.01, #P < 0.05, ##P < 0.01. n = 4–6/group.

