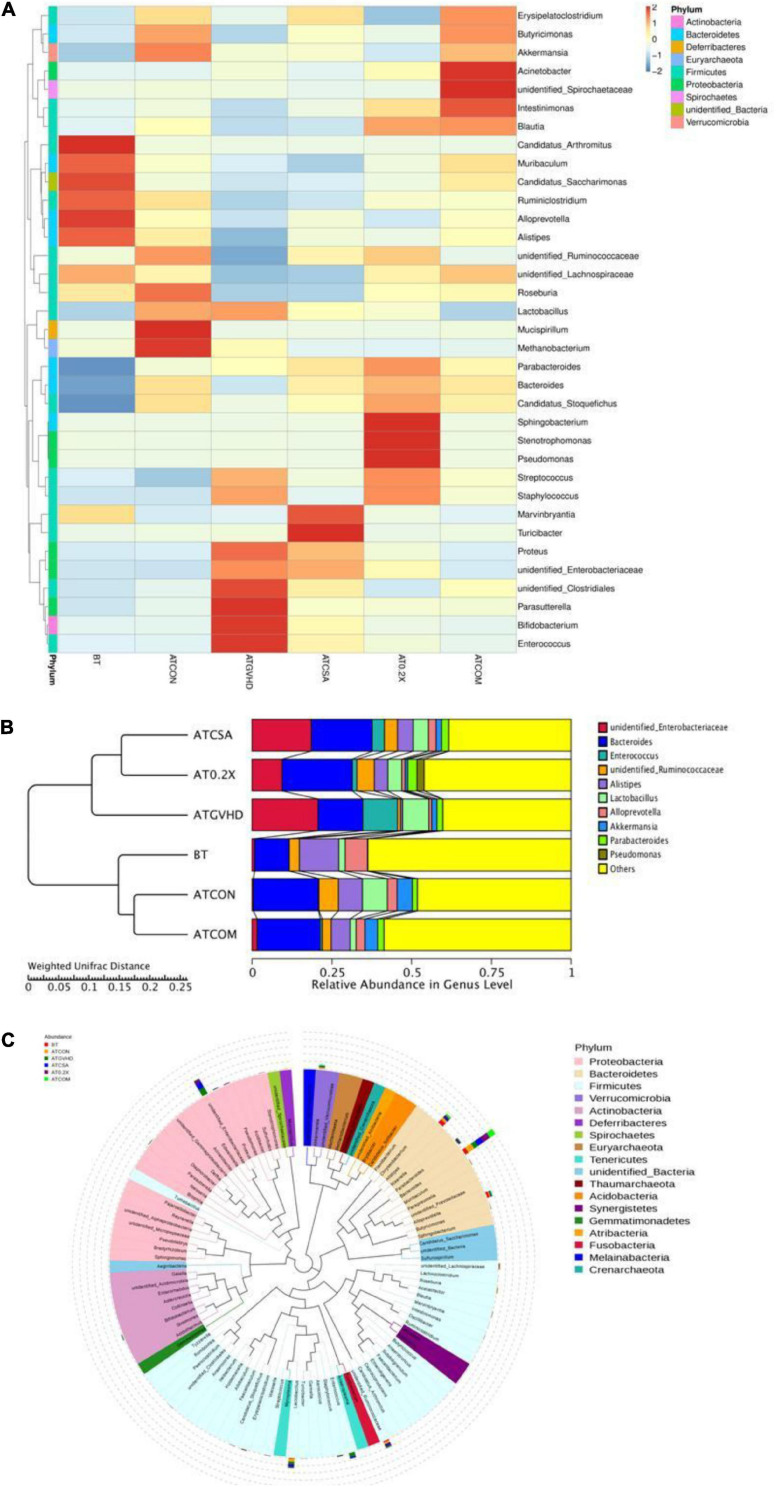
FIGURE 5.
Combination therapy rescued the disordered gut microbiota in GVHD mice at the genus level. (A) Cluster heat map of relative abundance of gut microbiota at the genus level in different groups of mice. The alteration of intestinal bacterial patterns at the genus level in different groups of mice was assessed using 16S high-throughput sequencing after BMT at day 7, n = 4–6/group. The heat map is color-based on row Z scores. The mice with the highest and lowest bacterial level are in red and blue, respectively. (B) The UPGMA tree based on weighted UniFrac distances in the genus level. The relative abundances of enteric bacteria at the genus level in different groups of mice were assessed using 16S high-throughput sequencing after BMT on day 7. n = 4–6/group. (C) Classification of the top 100 genera in the abundance of the gut microbiota and the dominant genera in different groups of mice. Dominant genera in different groups of mice were marked with indicated colors. Bar lengths indicated the abundance of the genus in different groups of mice.

