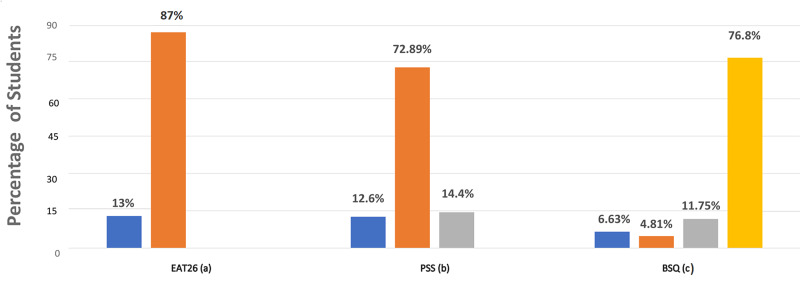
Figure 1. Proportion of Students in Different Risk Categories in the Three Questionnaires.
(a) High risk (13%) and low risk (87%); (b) high stress (12.6%), moderate stress (72.8%), and low stress (14.4%); (c) severe concern (6.63%), moderate concern (4.8%), mild concern (11.75%), and no concern (76.8%).

