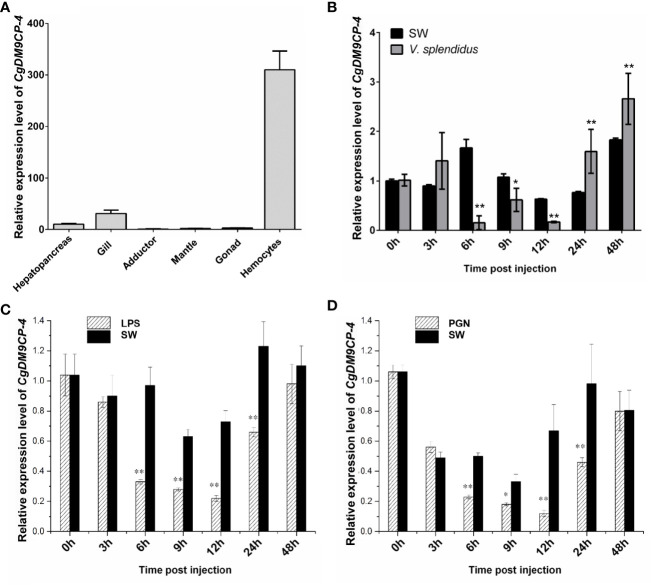
Figure 2.
Expression patterns of CgDM9CP-4 mRNA in different tissues and post stimulation by real-time PCR. (A) Comparison of the expression level of CgDM9CP-4 mRNA (relative to CgEF) among different tissues was normalized to adductor. Vertical bars represent the mean ± S.D. (N = 4). (B–D) Comparison of the level of CgDM9CP-4 mRNA (relative to CgEF) post V. splendidus (B), LPS (C) and PGN (D) were normalized to 0 h. Vertical bars represent the mean ± S.D. (N = 4). **P < 0.01, *P < 0.05.

