Figure 5.
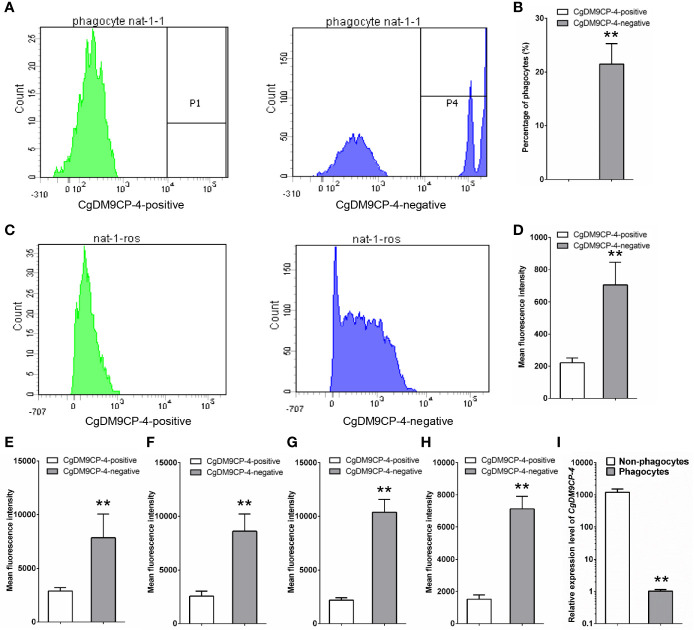
Phagocytic rate, ROS level and cytokine level of CgDM9CP-4-positive hemocytes detected by flow cytometry. (A) Phagocytic rate of CgDM9CP-4-positive and -negative hemocytes. (B) Quantification based on (A). (C) ROS level of CgDM9CP-4-positive and -negative hemocytes. (D) Quantification based on (C) (E–H) Relative protein levels of TNF (E:CGI_10008787, F: CGI_10008788), CgIFNLP (G) and CgIL17-5 (H) in CgDM9CP-4-positive and -negative hemocytes. (I) Expression level of CgDM9CP-4 mRNA in sorted phagocytes and non-phagocytes. Data represent the mean ± S.D. (N = 3). **P < 0.01.

