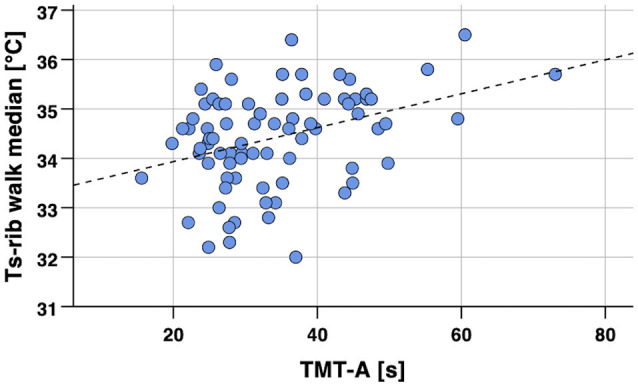
Figure 3.

Scatterplot of skin temperature (Tsrib median) during 8 min walking in the laboratory vs. cognitive performance (TMT-A, processing speed). Notes: Spearman’s partial correlation coefficient rs = 0.33, p < 0.002 (one-tailed, controlled for age). Regression line y = 33.25 + 0.03 × x (calculated from Pearson’s correlation analysis). TMT-A, Trail Making Test part A; Tsrib, skin temperature at the rib cage.
