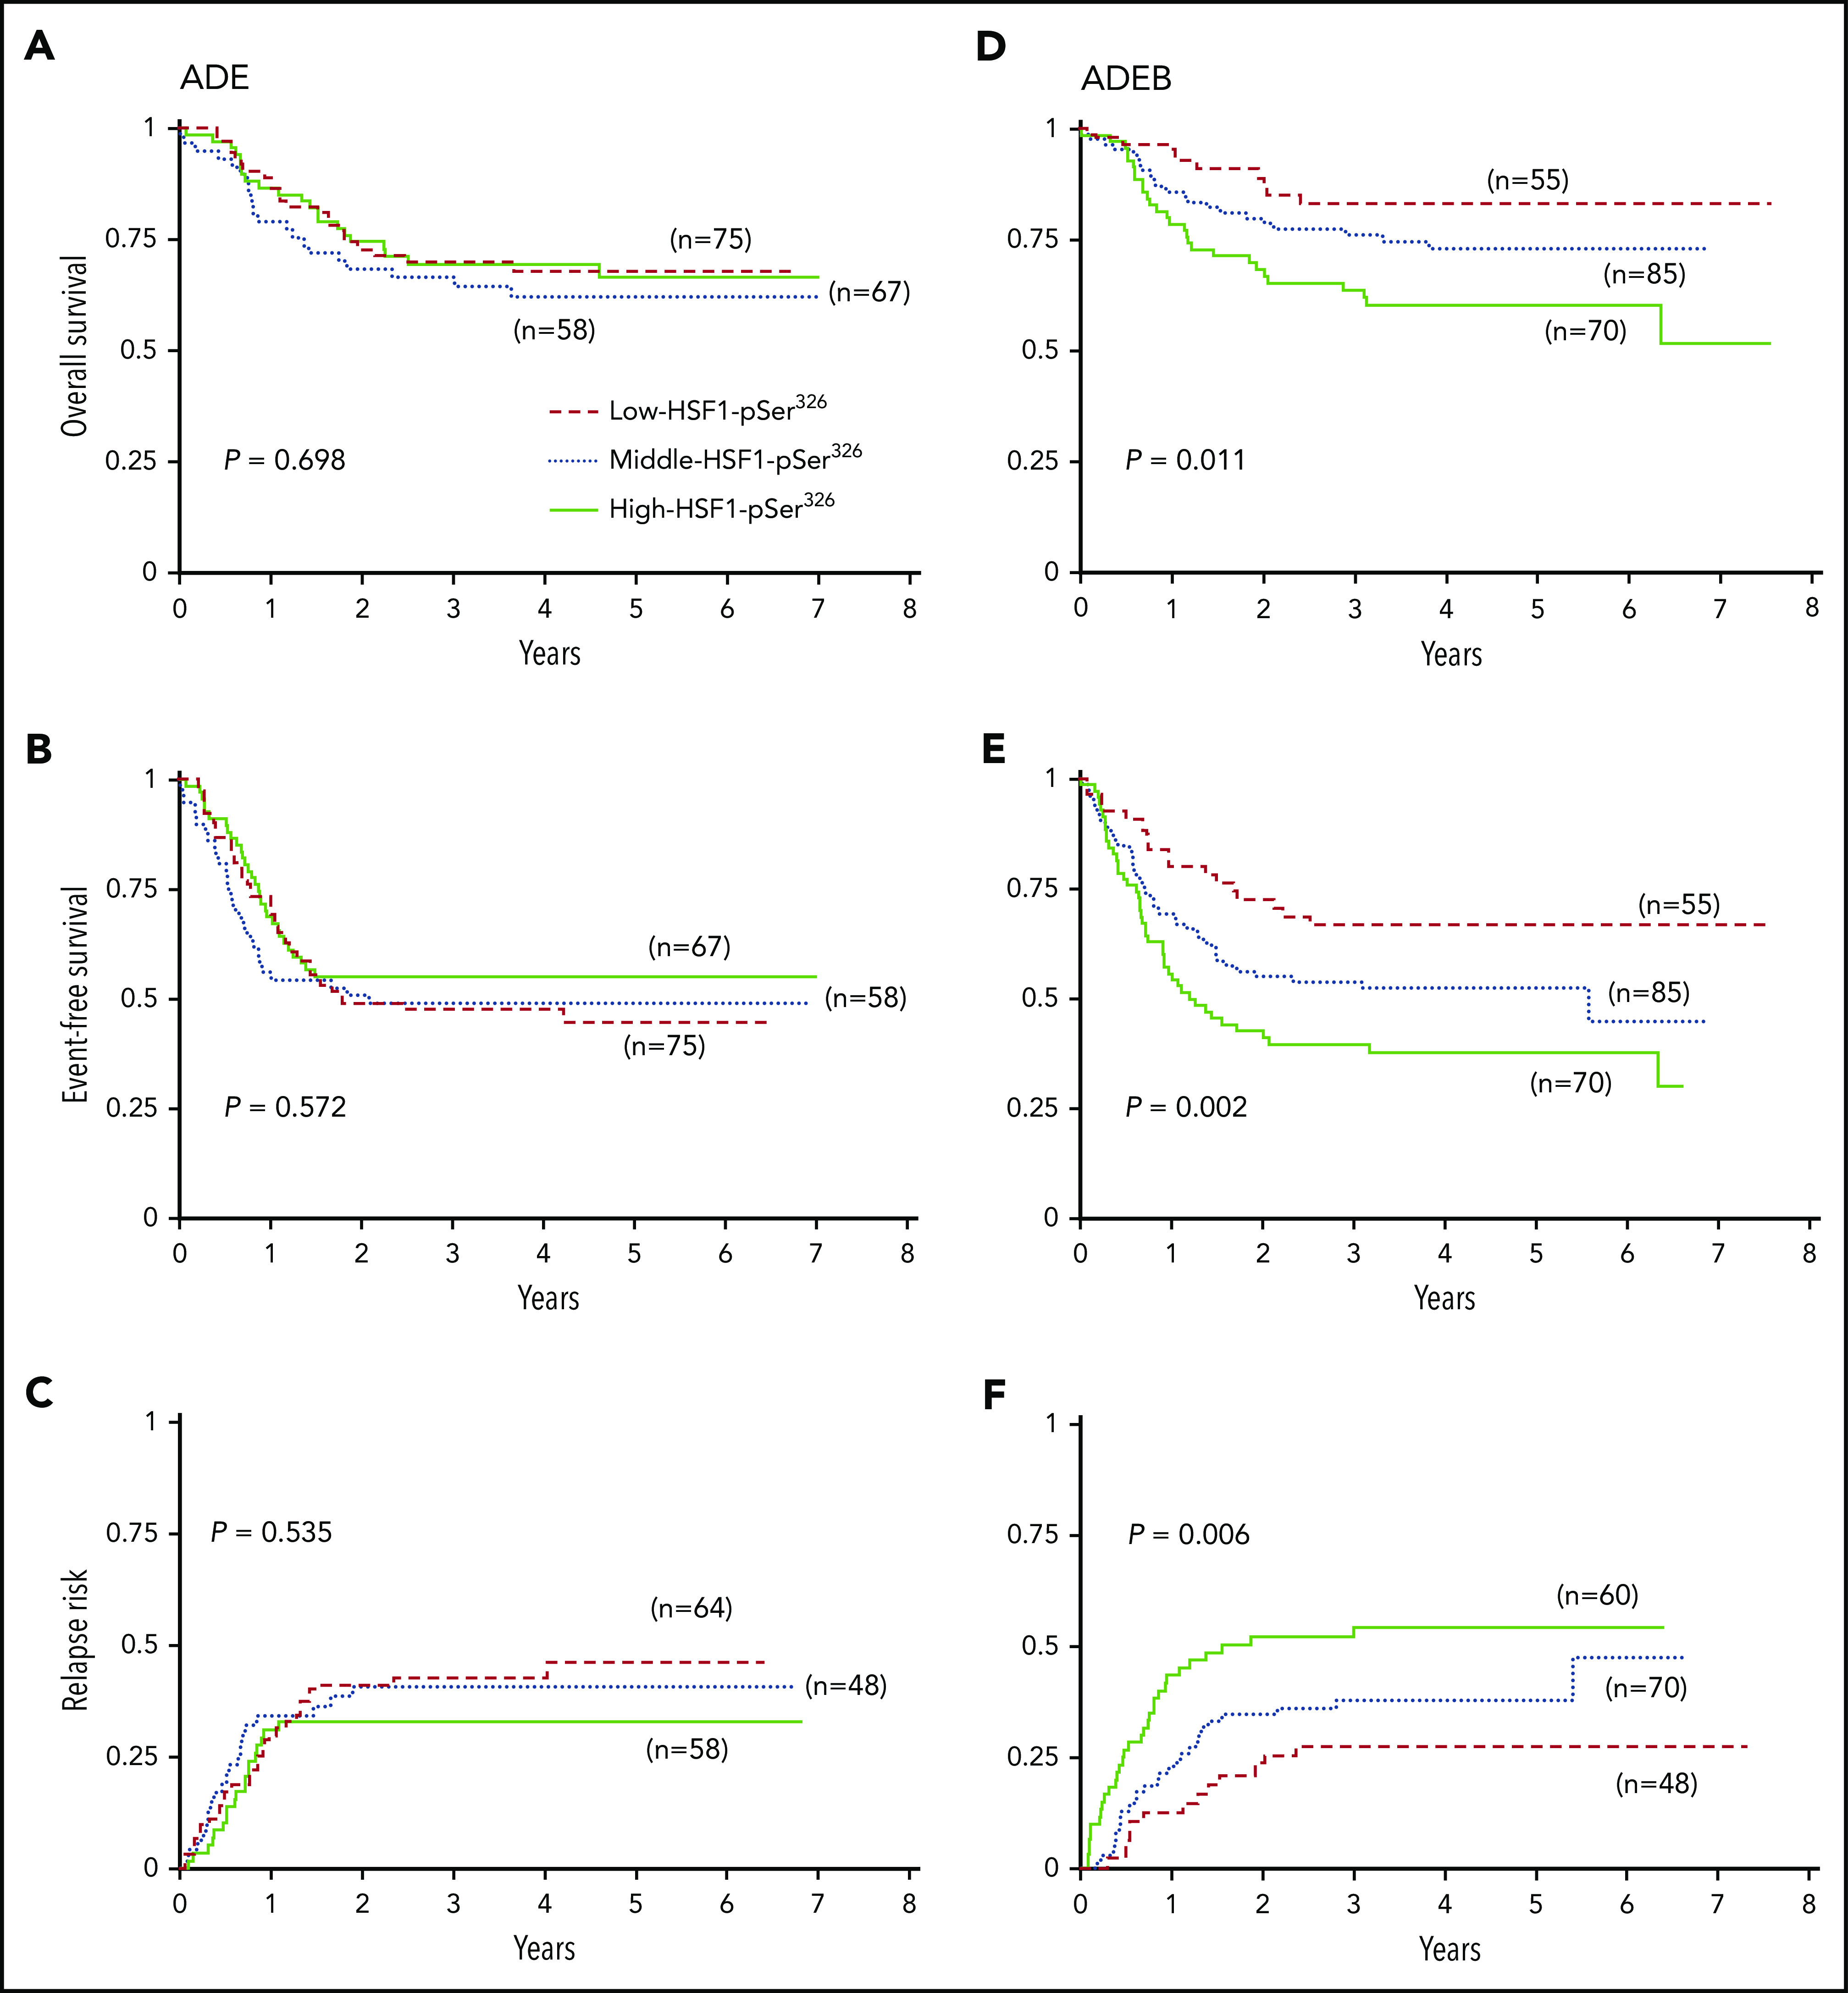
Figure 2.

Kaplan-Meier survival curves for OS, EFS, and RR. (A) OS, (B) EFS, and (C) RR for patients treated without the addition of BTZ (left). (D) OS, (E) EFS, and (F) RR for patients treated with the addition of BTZ to ADE (right). Dashed red lines indicate low-HSF1-pSer326 patients, dotted blue lines represent middle-HSF1-pSer326, and solid green lines represent the high-HSF1-pSer326.
