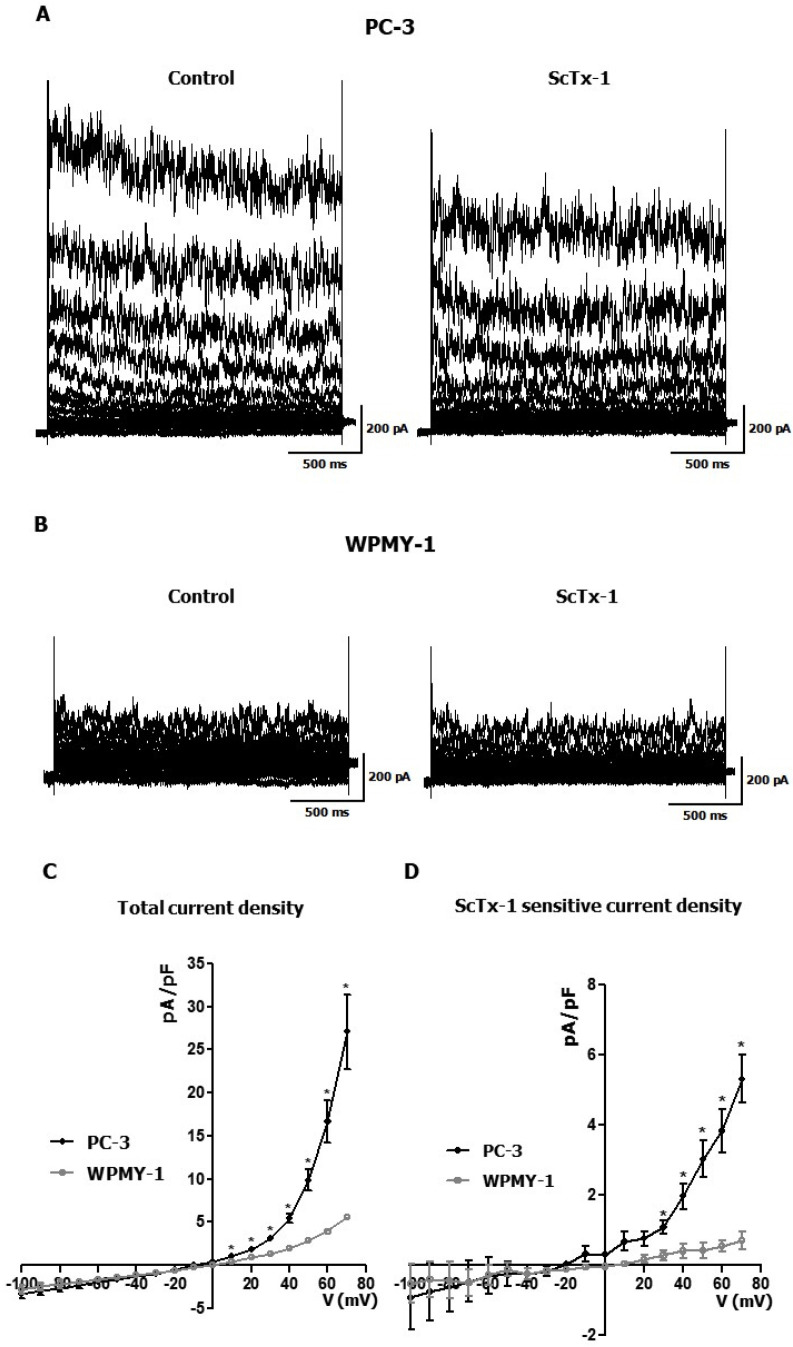
Fig. 2.
Whole-cell patch-clamp recording of Kv2.1 current in WPMY-1 and PC-3 cells. (A) Representative current traces in PC-3 cells in the absence (Control, left) and presence of 600 nM ScTx-1 (right). (B) Representative current traces in WPMY-1 cells in the absence (Control, left) and the presence of 600 nM ScTx-1 (right). (C) Current density-voltage relationships between Kv current in WPMY-1 and PC-3 cells (n = 5). (D) Current density-voltage relationship between ScTx-1-sensitive current in WPMY-1 and PC-3 cells (n = 3). The cells were held at −60 mV, and the currents were elicited by a test pulse ranging from −100 mV to +70 mV at 10 mV increments. All experiments were performed as indicated and the data are presented as mean ± standard error. *P < 0.05 versus the WPMY-1 value.

