Fig. 1.
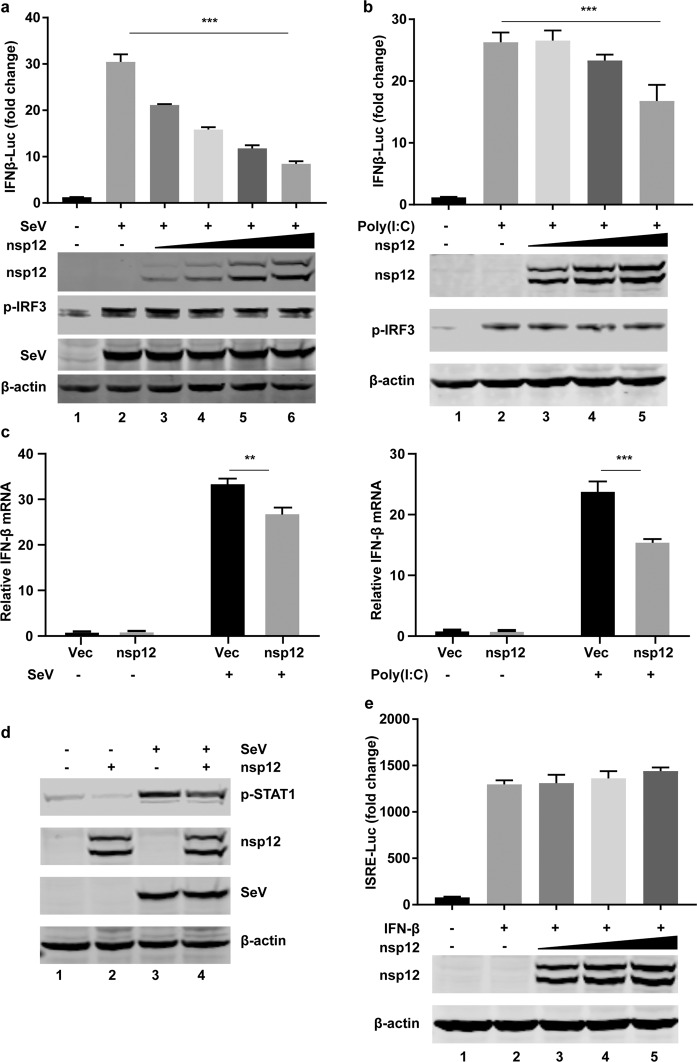
SARS-CoV-2 nsp12 attenuates viral RNA-related type I interferon responses. a Effects of nsp12 on SeV-induced IFN-β promoter activation. HEK293T cells were transfected with an IFN-β reporter plasmid along with a control plasmid or with increasing amounts of plasmids expressing nsp12. The cells were infected with SeV for 12 h and assayed for luciferase activity. The indicated protein expression levels were analyzed by western blotting. p-IRF3 was used to assess the stimulation after SeV infection. b Effects of nsp12 on high-molecular weight poly(I:C)-induced IFN-β promoter activation. HEK293T cells were transfected with an IFN-β reporter plasmid along with a control plasmid or with increasing amounts of plasmids expressing nsp12. The cells were transfected with high-molecular weight poly(I:C) for 12 h and assayed for luciferase activity. The indicated protein expression levels were analyzed by western blotting. p-IRF3 was used to assess the stimulation of poly I:C treatment. c Effect of nsp12 on endogenous IFN-β mRNA expression induced by SeV (left) and high-molecular weight poly(I:C) (right). HEK293T cells were transfected with a control plasmid or a plasmid expressing nsp12. After 24 h, cells were infected with SeV for 8 h or transfected with high-molecular weight poly(I:C) for 6 h. Total RNA was extracted, and the expression of IFN-β was detected by real-time RT-PCR. d Effect of nsp12 on endogenous p-STAT1 induced by SeV. HEK293T cells were transfected with a control plasmid or a plasmid expressing nsp12. After 24 h, the cells were infected with SeV for 8 h. Whole-cell lysates were analyzed by western blotting for p-STAT1, nsp12, and P protein of SeV. e Effects of nsp12 on IFN-induced ISRE promoter activation. HEK293T cells were transfected with an ISRE-Luc reporter plasmid along with a control plasmid or with increasing amounts of plasmids expressing nsp12. After 24 h, the cells were treated with IFN (1000 U/ml) for 12 h and assayed for luciferase activity. The indicated protein expression levels were analyzed by western blotting. All experiments were performed at least twice, and one representative is shown. The error bars indicate the SDs of technical triplicates. One-way ANOVA (or the nonparametric equivalent) was used for column analyses (a, b). The two-tailed unpaired t-test was used for two-group comparisons (c). **P < 0.01, ***P < 0.001

