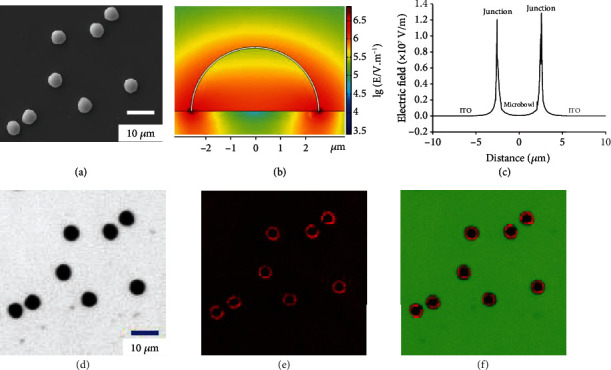
Figure 1.

Computed electric field and ECL images at the heterogeneous interface. (a) SEM images of Au microbowls in a face-down configuration on the supporting surface. (b) The simulated electric field at the ITO surface with Au microbowls (face-up view). The rainbow bar is the logarithm value of the electric field intensity. (c) The electric strength at the heterogeneous interface with the microbowl and planar ITO surface. (d) Bright-field, (e) ECL, and (f) overlapping image of Au microbowls on the ITO slide. The ECL images are recorded in 10 mM PBS (pH = 7.2) that contains 5 mM Ru(bpy)32+ and 50 mM TPrA.
