Figure 4.

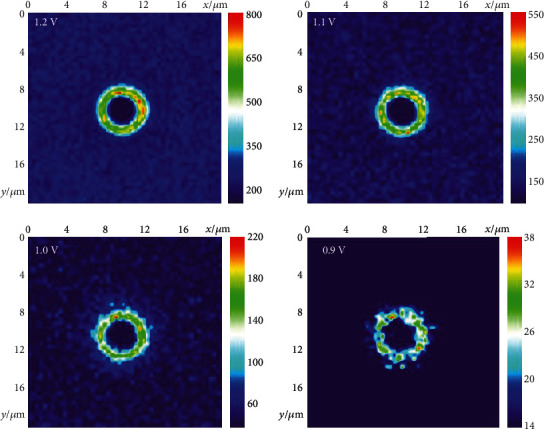
ECL images at different voltages. The false-color ECL images of microbowls at the supporting ITO surface applied with different voltages. The color presents the ECL intensity.

ECL images at different voltages. The false-color ECL images of microbowls at the supporting ITO surface applied with different voltages. The color presents the ECL intensity.