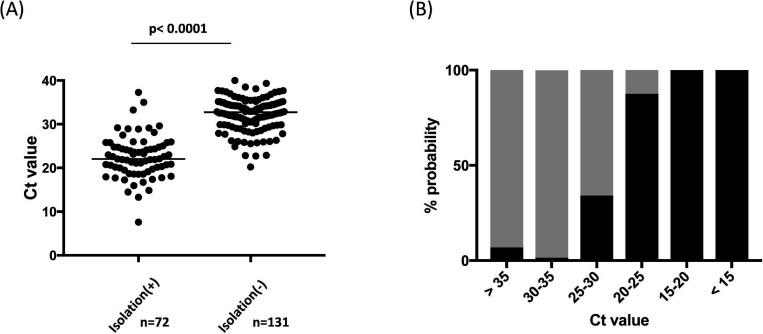
Figure 2.
Correlation of successful virus isolation with cycle threshold (Ct) value from SARS-CoV-2 real-time RT-PCR (rRT-PCR) in 203 positive upper respiratory specimens. (A) Ct values obtained from rRT-PCR of upper respiratory specimens were compared between virus isolation positives and negatives. (B) Percentage of positive (black bar) and negative (grey bar) viral isolation of upper respiratory specimens according to the range of Ct values, expressed as probabilities.

