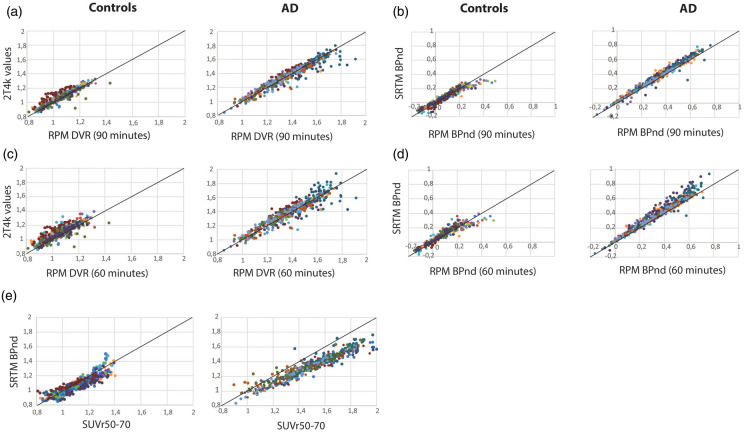
Figure 3.
Correlations between RPM DVR (panel A and C [controls and AD patients respectively]), 2T4k_VB-derived DVR and, RPM BPND (panel B and D) and SRTM BPND for +1both 90- and 60-min scan durations and for both AD patients and controls. Panel E shows correlations between SRTM BPND and SUVr50–70. Different colours reflect different regional estimations of each participant.

