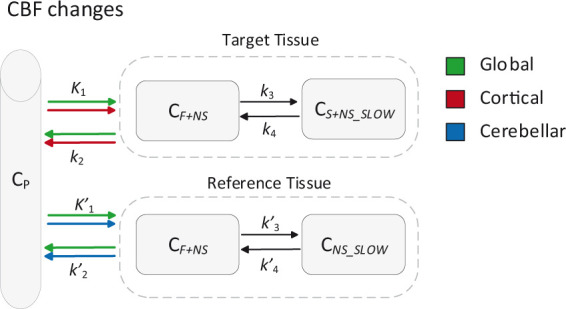
Figure 2.

Schematic overview of the simulated CBF changes. CP: tracer plasma radioactivity concentration, CF+NS: free and non-specifically bound concentration in tissue, CS+NS_SLOW: specifically bound and slow non-specifically bound concentration in tissue, all units Bq*ml−1. Units of the rate constants: K1 in ml × g−1 × min−1 and k2, k3, k4 in min−1.
