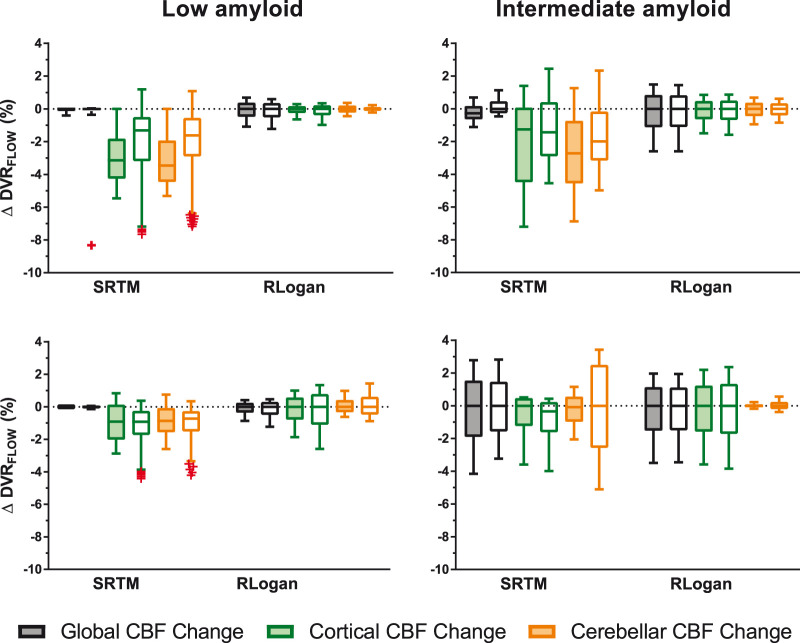
Figure 5.
Comparison of full and interval TACs and their sensitivity to CBF changes. Coloured boxes represent full- and uncoloured boxes interval TACs. Upper row [18F]flutemetamol, bottom row [18F]florbetaben. Note: whiskers were defined according to the Tukey method and outliers are depicted as red crosses.

