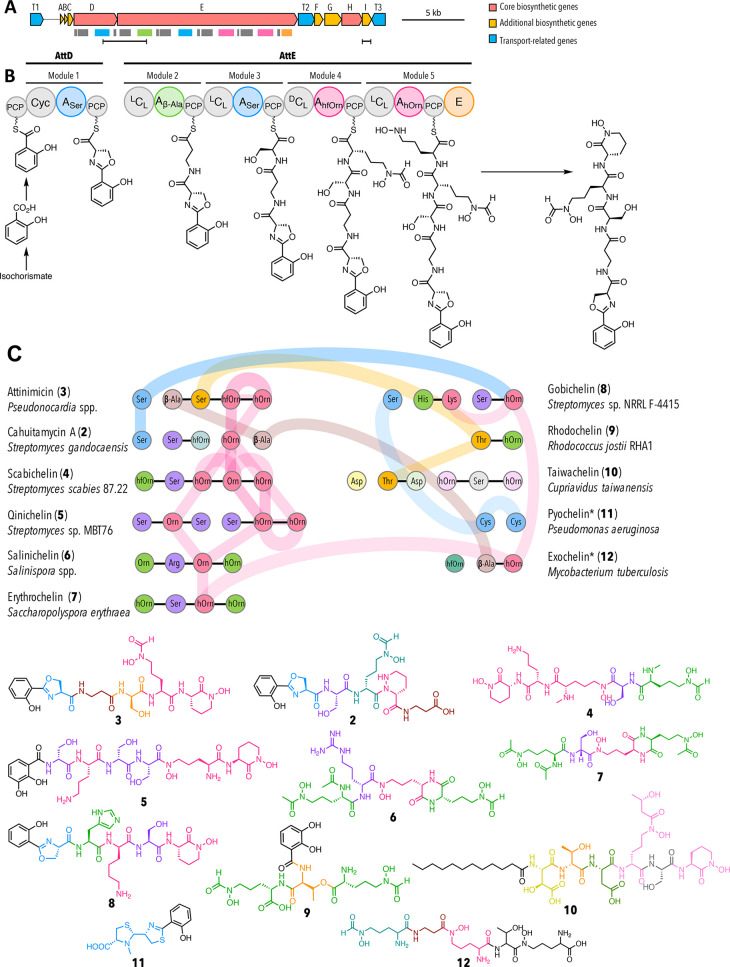
Figure 4.
Bioinformatic analysis of the putative attinimicin biosynthetic gene cluster. (A) Attinimicin biosynthetic gene cluster. Colored rectangles indicate the domains shown in B. Horizontal black bars represent regions amplified for PCR-based detection of the att BGC (left) and att-like BGC (right); (B) proposed model for attinimicin biosynthesis. A, adenylation domain–amino acids in subscript indicate the monomers incorporated into the nascent peptide; PCP, peptidyl carrier protein; Cyc, cyclization domain; DCL, condensation domain that catalyzes the peptide bond between the terminal d-amino acid of the growing peptide chain and an l-amino acid to be incorporated; LCL, condensation domains condense two l-amino acids; E, epimerization domain; (C) Proposed evolutionary relatedness between the attinimicin and other siderophore NRPSs based on phylogenetic analysis of adenylation domains (for a detailed representation see Supporting Information, Figure 14). Only relationships between attinimicin and other clusters are shown. Horizontal black lines represent domains encoded on the same gene; colored vertical lines and colored horizontal connections represent domains that are evolutionarily related and/or duplicated.

