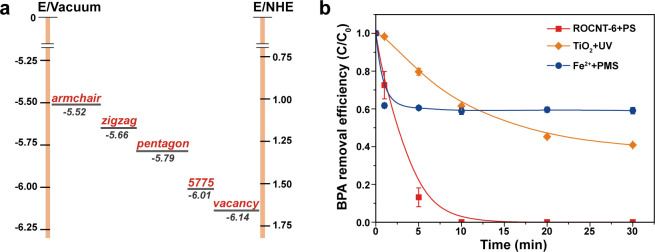
Figure 6.
Redox potential investigation of the CNT/PS system. (a) Schematic illustration of the energy diagram for CNTs with PS adsorption on different defect sites obtained from DFT calculations. (b) Catalytic degradation of BPA in the actual water body (Pearl River in China). Reaction conditions: [BPA] = 20 mg/L, [PS] = [PMS] = 1.5 mmol/L, [ROCNT-6] = [TiO2] = [Fe2+] = 0.1 g/L, T = 298 K.

