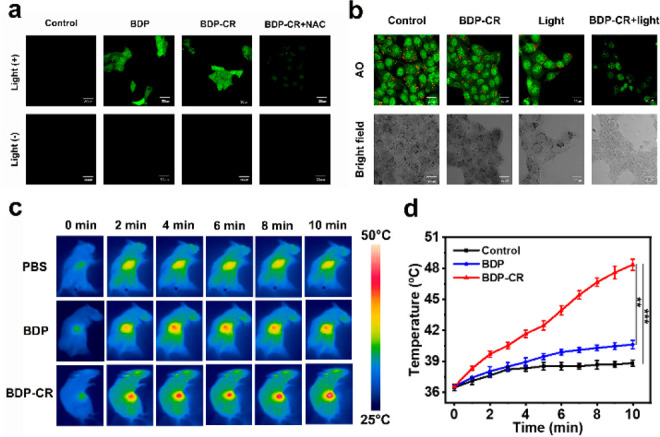
Figure 4.

(a) Evaluation of 1O2 generation in 4T1 cells. (b) CLSM images of AO staining for lysosomal integrity. (c) IR thermal images of 4T1 tumor-bearing mice following 671 nm laser (0.3 W/cm2) irradiation at different time points. The laser exposure was performed at 4 h after injection of 100 μL of BDP-CR, BDP, or PBS. (d) Temperature changes at the tumor sites as a function of the 671 nm laser (0.3 W/cm2) irradiating time, which is the quantitative data of part c. Scale bars: 30 μm. Error bars, mean ± SD (n = 4), **P < 0.01, ***P< 0.001 determined by the Student’s t test.
