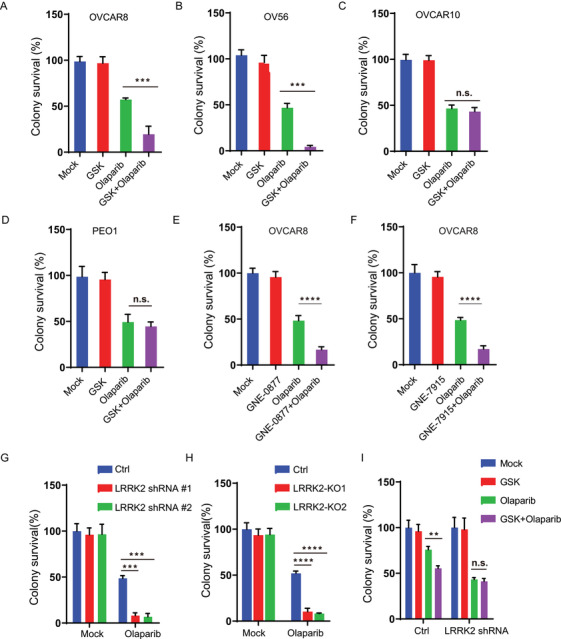
FIGURE 2.

LRRK2 inhibition enhances PARP inhibitor cytotoxicity in ovarian cancer cells. (A‐C) Colony formation analysis of OVCAR8 (A), OV56 (B), and OVCAR10 (C) cells treated with control (Mock), GSK2578215A (GSK, 1 μM), Olaparib (0.8 μM), or their combination (GSK + Olaparib). (D) Colony formation analysis of PEO1 cells treated with control (Mock), GSK2578215A (GSK, 1 μM), Olaparib (0.3 μM), or their combination (GSK + Olaparib). (E‐F) Colony formation analysis of OVCAR8 cells treated with control (Mock), GNE‐0877 (1 μM), GNE‐7915 (1 μM), Olaparib (0.8 μM), or their combination (GNE‐0877 + Olaparib or GNE‐7915 + Olaparib). (G) Colony formation analysis of control and LRRK2 knockdown OVCAR8 cells treated with Olaparib (0.8 μM). (H) Colony formation analysis of control and LRRK2 knockout OVCAR8 cells treated with control (Mock) or Olaparib (0.8 μM). (I) Colony formation analysis of control and LRRK2 knockdown OVCAR8 cells treated with control (Mock), GSK2578215A (GSK, 1 μM), Olaparib (0.2 μM), or their combination (GSK + Olaparib). Data are shown as mean ± SEM from three independent experiments. P‐value was determined by two‐tailed unpaired t‐test (*, P < .05; **, P < .01; ***, P < .001; n.s., no significance)
