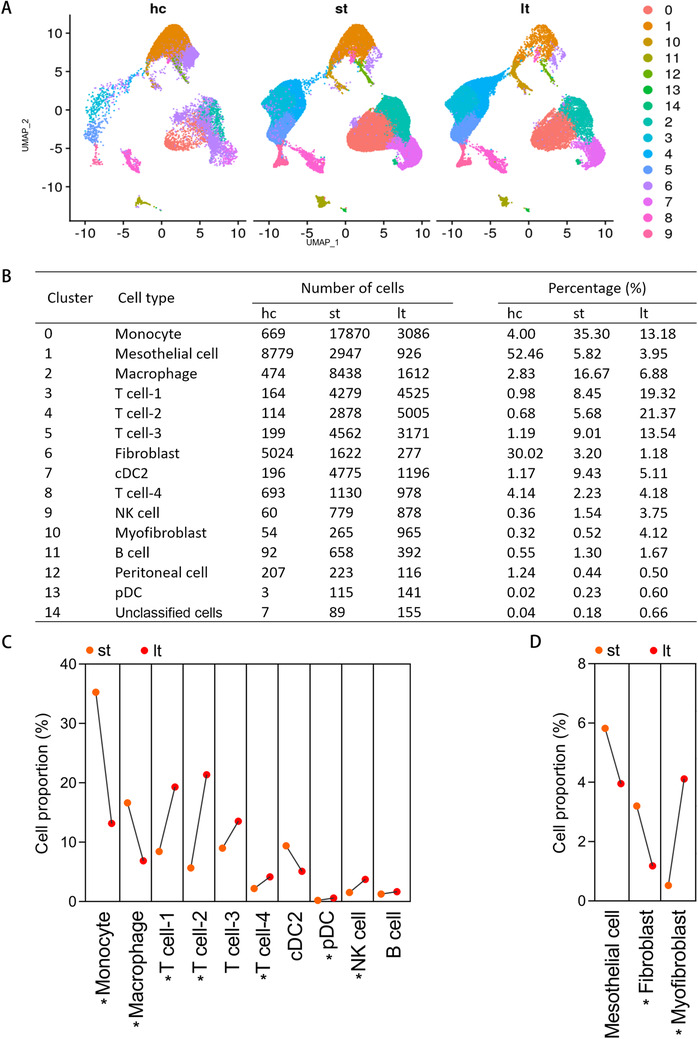
FIGURE 2.

Single‐cell transcriptomic analysis delineates heterogeneous cell populations between normal human peritoneum, effluent of patients undergoing short‐term PD, and effluent of patients undergoing long‐term PD. (A) UMAP plot of healthy control group (hc), effluent of patients undergoing short‐term PD (st), and effluent of patients undergoing long‐term PD (lt) are displayed separately. (B) Percentages of assigned cell types in each group are summarized. (C) Line chart showing the changes in the proportions of cell populations in immune cells between st and lt groups. (D) Line chart showing the changes in the proportions of cell populations in mesenchymal cells between st and lt groups. * p < 0.05, Mann–Whitney U test
