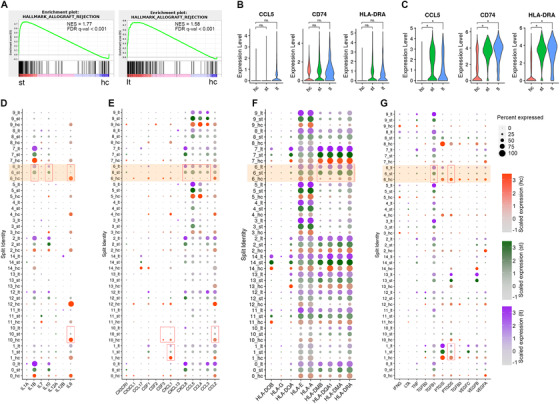
FIGURE 4.

The scRNA‐seq analysis reveals distinct expression profiles of inflammatory genes in fibroblast and the other cell populations across each group. (A) Gene Set Enrichment Analysis was performed using the gene set of Allograft rejection for fibroblasts in both short‐term dialysis group and long‐term dialysis group compared with control group. (B and C) Violin plots of expression for select genes in mesothelial cells (B) and fibroblasts (C). (D–G) Expression of selected genes: (D) interleukins, (E) chemokines and receptors, (F) human leukocyte antigens, and (G) cytokines, separated by hc, st, or lt group. Dot size represents the percentage of cells expressing the corresponding gene, and dot color represents the average expression level. The orange‐colored blocks highlight the cluster 6 (fibroblasts). Each red box indicates there were significant differences (p < 0.05 and |log2(fold change) | ≥ 0.58, Student's t‐test) in the expression of corresponding genes in both comparisons (st vs. hc, lt vs. hc). For (B) and (C), the * symbol indicates p < 0.05 and |log2(fold change) | ≥ 0.58, Student's t‐test
