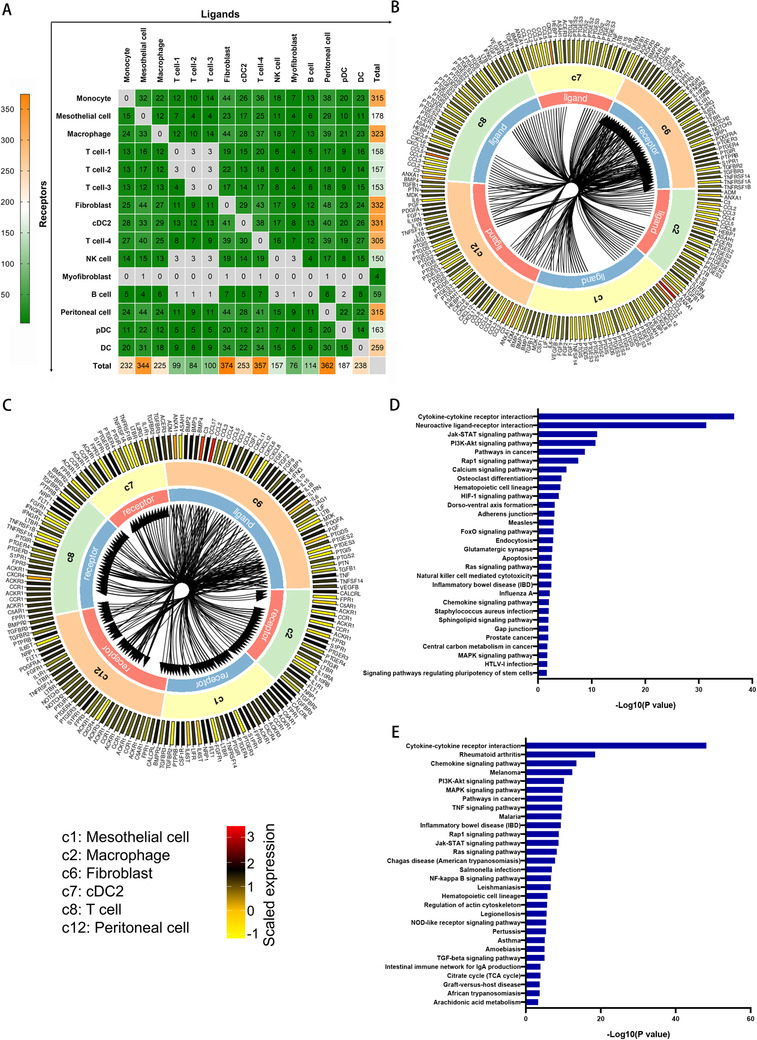
FIGURE 5.

Putative receptor‐ligand interactions between fibroblast and multiple cell populations. (A) Heatmap showing the number of ligands and receptors estimated to have arisen at each paired cell populations. The X axis represents the numbers of ligands, and Y axis represents the numbers of receptors for the corresponding cell populations. (B) Circular plot displays the impact of five cell populations on fibroblast. Lines originate at the ligand and connect to its receptor as indicated by the arrowhead. (C) Circular plot displays the impact of fibroblast on five cell populations. Lines originate at the ligand and connect to its receptor as indicated by the arrowhead. c1 represents mesothelial cell, c2 represents macrophage, c6 represents fibroblast, c7 represents cDC, c8 represents T cell, and c12 represents peritoneal cell. The outer ring represents ligands and receptors, and colors correspond to the average expression level for the gene. (D) Functional enrichment analysis with GO biological processes was performed for downstream pathways of the receptors. (E) Functional enrichment analysis with GO biological processes was performed for downstream pathways of the ligands
