Figure 1.

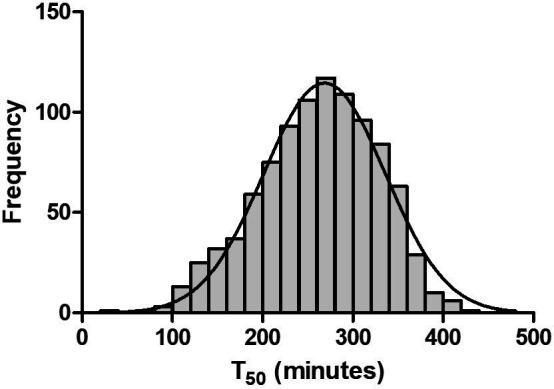
Frequency distribution of serum T50. The serum T50 values (in minutes) approximate a normal distribution (indicated by the Gaussian curve).

Frequency distribution of serum T50. The serum T50 values (in minutes) approximate a normal distribution (indicated by the Gaussian curve).