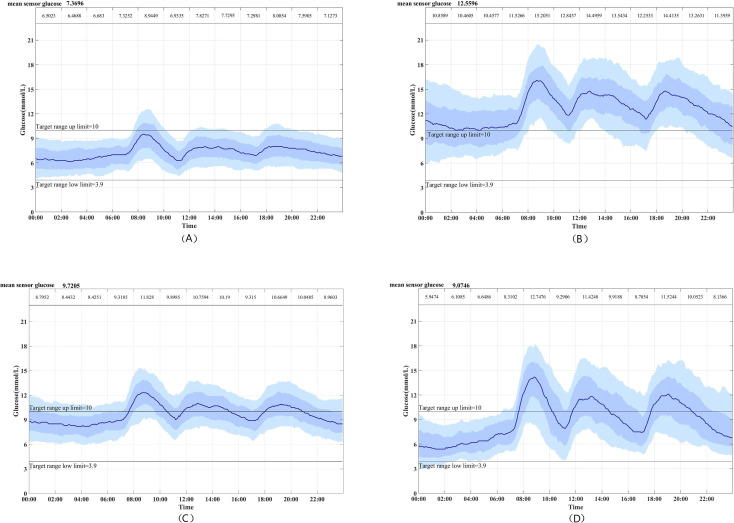
Figure 2.
Continuous glucose monitoring curve of each subgroup: (A) cluster 1, (B) cluster 2, (C) cluster 3 and (D) cluster 4. The solid line is the median. The dark blue bar means the 25th–75th percentiles and the light blue bar means the 10th–90th percentiles. The mean sensor glucose is given at the top left corner.

