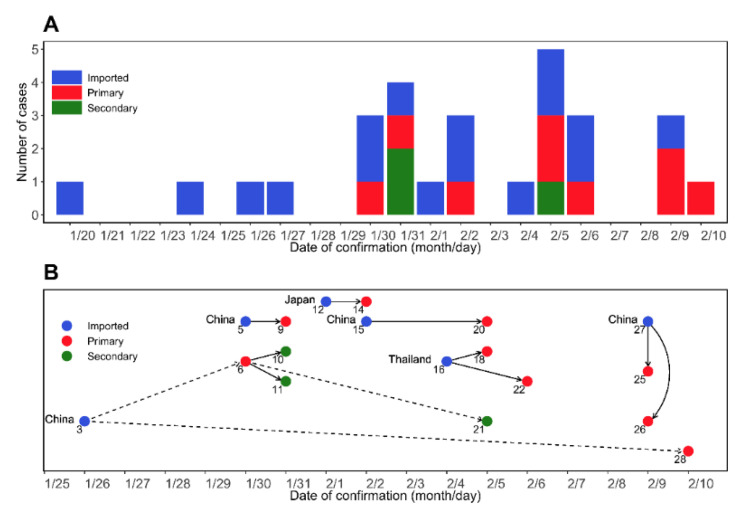
Figure 1.
COVID-19 epidemic curve and chain of contagion in a sample of patients in the Republic of Korea. 20 January–10 February 2020. (A) An epidemic curve over the confirmed dates. The confirmed cases were grouped as imported cases (blue), primary (red), and secondary (green) infections. Note that the imported cases are the patients who were already infected. (B) A chain of COVID-19 infection by confirmation date in Korea from 20 January to 10 February 2020. The imported cases (blue) are annotated with the country of importation. Solid arrows and dashed arrows represent transmission relationships that are between family members and friends, respectively.

